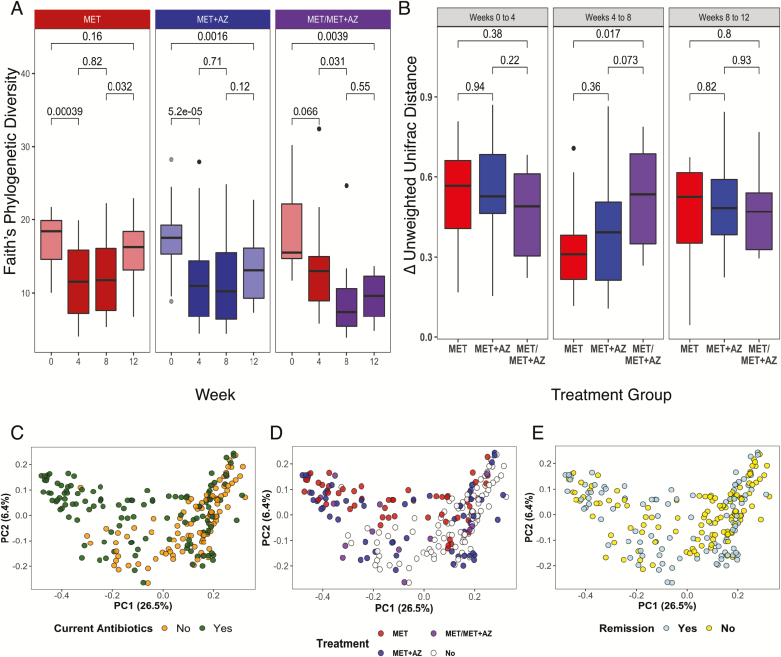
FIGURE 2.
Microbiota response to antibiotic therapy. A, Alpha diversity measured by Faith’s Phylogenetic Diversity, segregated by treatment group (MET, red; MET+AZ, blue; MET/MET+AZ, purple) and week. Treatment group colors are darker during antibiotic treatment. P values are displayed for comparisons between treatments (Wilcoxon test). B, Boxplot of the median intrasubject unweighted UniFrac pairwise distance among samples collected during consecutive time points. C–E, Principal coordinates analysis on the unweighted UniFrac pairwise distances among all samples and all subjects. Samples are colored by (C), current antibiotic use, yes/no (PERMANOVA, P < 0.01); (D) current antibiotic use and treatment group (PERMANOVA, P = 0.1) and remission status (PERMANOVA, P < 0.05); and (E) current disease state, in remission or not. The significance of treatment group clustering was determined by PERMANOVA (adonis) with 1000 permutations. Bonferroni correction was applied for multiple comparisons.

