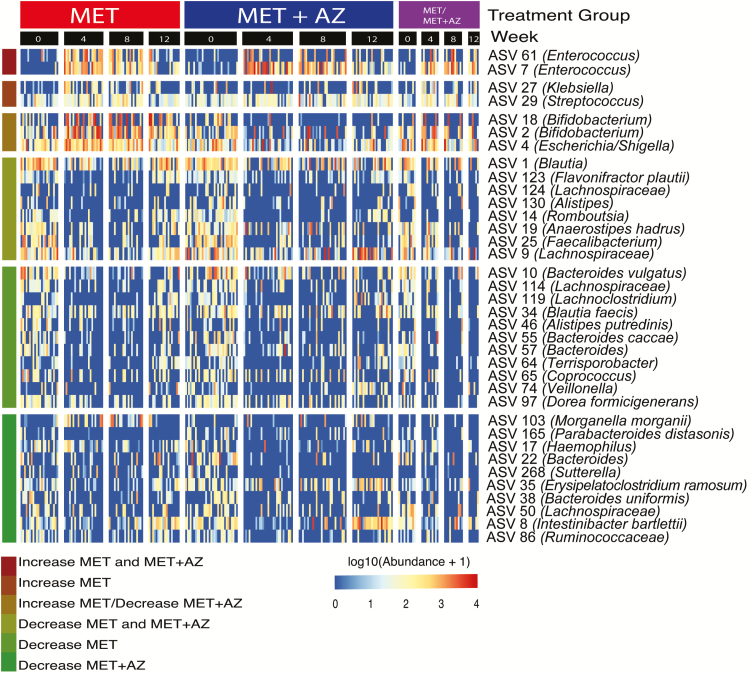
FIGURE 3.
Microbial abundances shift in response to antibiotic exposure. ASVs were filtered for presence in at least 20% of samples. Testing for significant differences in ASV abundance between weeks 0 and 4 was performed using DeSeq2 in either the MET or MET+AZ treatment group. Only ASVs with significant differences in abundance between weeks 0 and 4 are displayed. Abundances of ASVs were log10-transformed before plotting and partitioned by treatment group and week. Colored bars at the left end of the heatmap denote ASV responses to the treatments.

