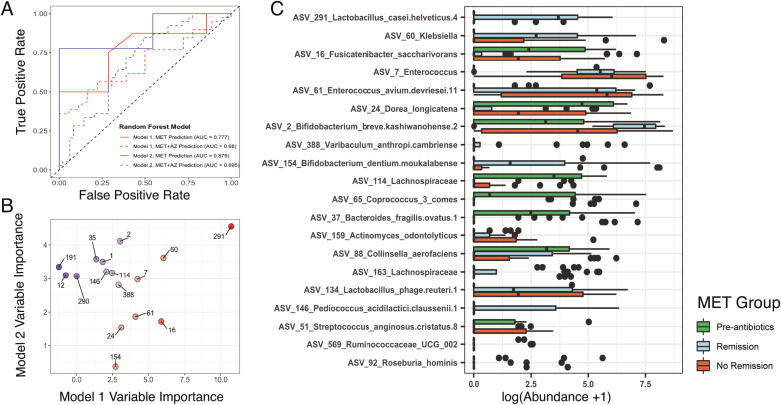
FIGURE 5.
Random forest models classify disease remission from microbiota profiles. A, The ROC curves indicate the accuracy of the random forest classification models built using microbiota data. The color of the lines indicates the data set on which the model was trained (Model 1, MET weeks 4 and 8, red; Model 2, MET weeks 0, 4, and 8, blue). Solid lines indicate the accuracy of the model in classifying remission in patients from the same treatment group (MET), whereas the dashed lines indicate the accuracy of each model for classifying remission in patients from the MET+AZ treatment group. B, Variable importance values for the 10 most important ASVs used to build each random forest model are plotted against each other. Points are labeled by ASV number. The point color indicates the importance score (Model 1 specific, red; Model 2 specific, blue; both models, gray). C, Log-transformed abundances of the top 20 ASVs that were of common importance for both random forest models.

