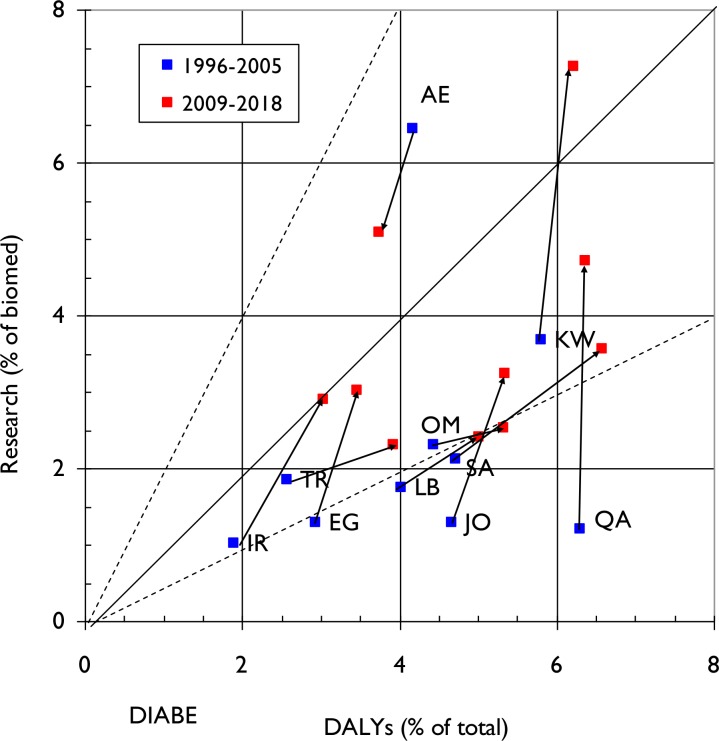
Fig 5. Graph demonstrating relative commitment of each ME country to diabetes research (proportion of papers in diabetes out of total for biomedicine) compared to its diabetes specific disease burden (measured as a percentage of DALYS attributable to Diabetes relative to total country-specific DALYS) for two 10-year time periods (1996–2005 and 2009–18).
Arrows demonstrate change in direction of commitment to particular NCD domain research in the two time periods. The solid diagonal line represents exact equivalence of percentages, and the dashed lines represent values of research that are just twice, or half, the amounts corresponding to the percentage of DALYs.

