
Figure 5.
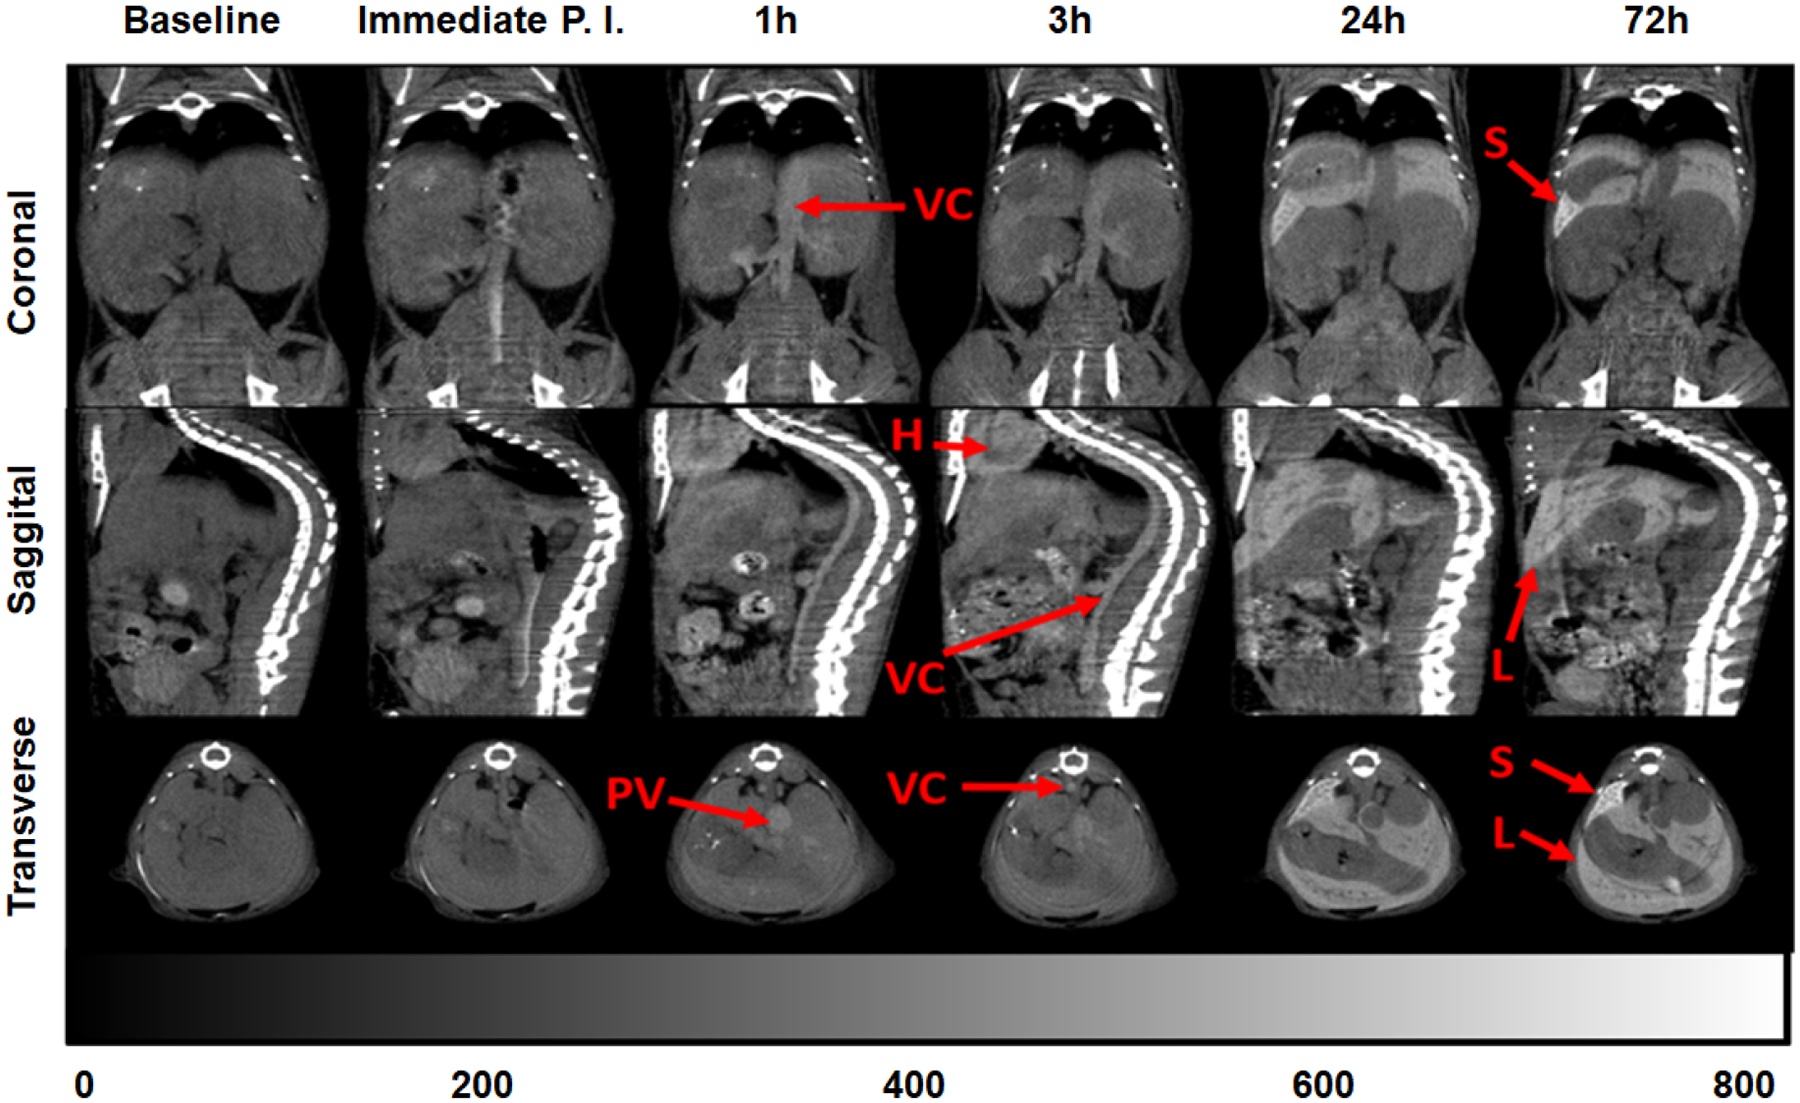
In vivo X-ray micro-CT imaging. a.) Orthogonal views (Coronal, Sagittal, Transverse) of the same representative BALB/c mouse at serial scan time points (0 h baseline, immediate post-injection, 1, 3, 24, 72 h post-injection) of a single, bolus dose (217 μL, 592.3 mg kg−1, IV) 200 mM TaOx NC1. Hounsfield Unit (HU) scale bar shows hyperintensity of vena cava (VC), spleen (S), heart (H), liver (L) and portal vein (PV).