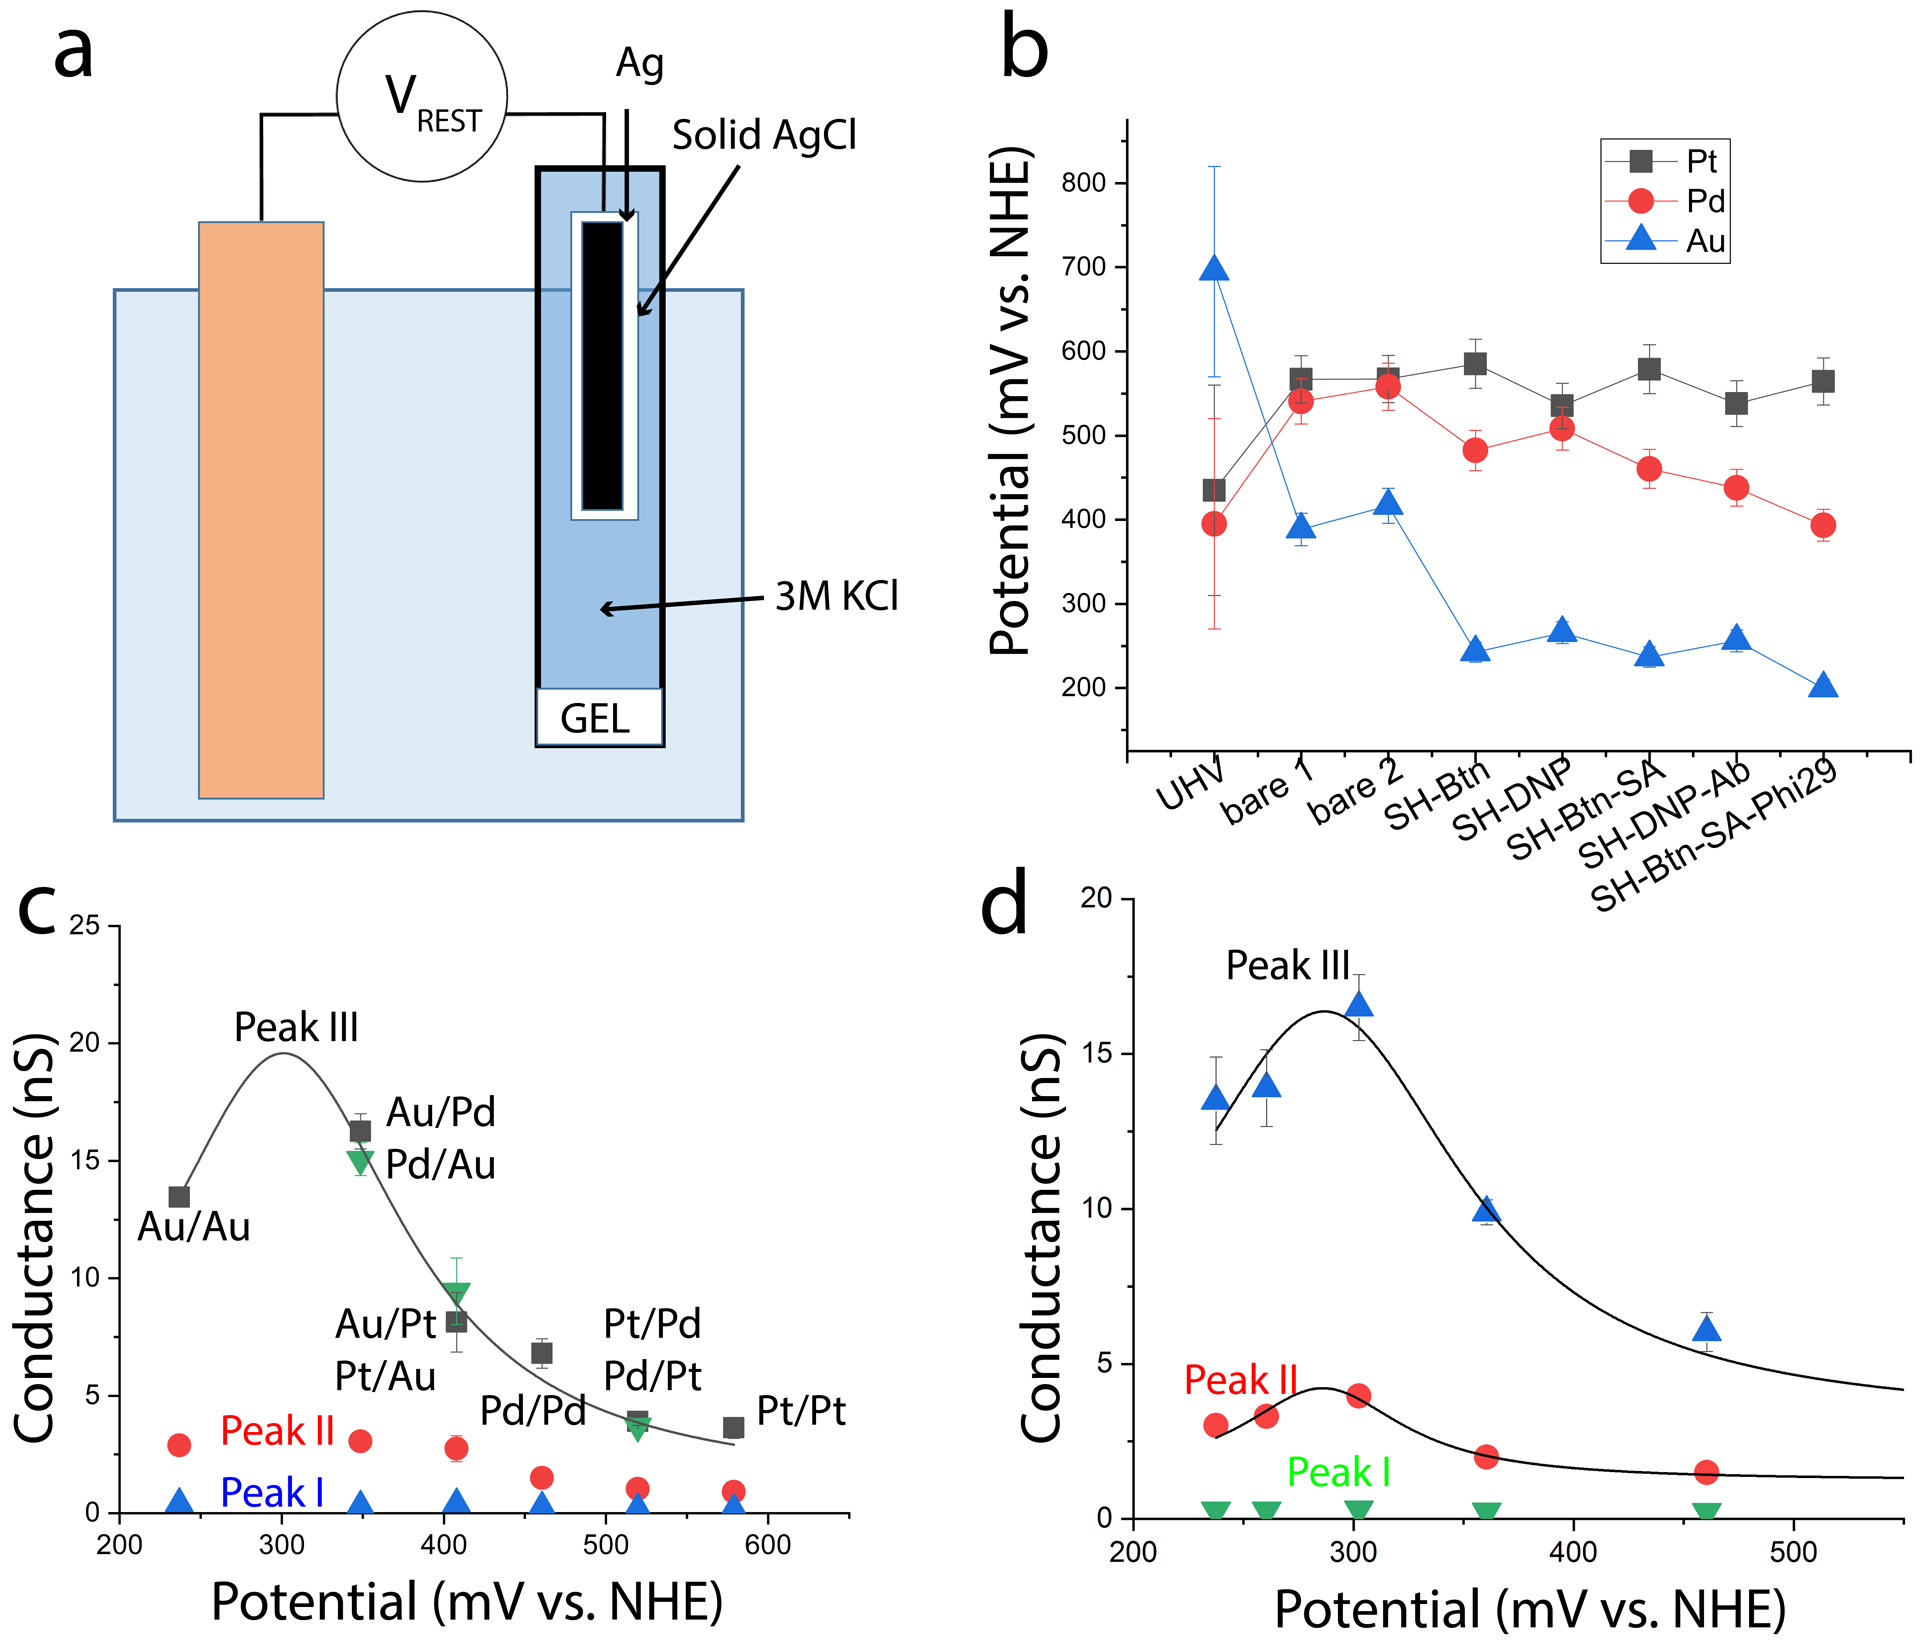
Figure 2:

Streptavidin conductance depends on potential. (a) Rest potentials are measured using a high-impedance voltmeter (VREST) connected between the electrode and a salt-bridged reference electrode. In this case the KCl concentration is 3M, corresponding to a 210 mV shift relative to the NHE scale. (b) Change in rest potentials with surface functionalization as decribed in Table I. Points from UHV are translated to the NHE scale using the work function of the NHE. (c) Conductance peak values for a streptavidin molecule as a function of electrode material (as marked, the first listed material is the STM tip, the second the substrate). Green triangles are for reversed combinations for the tip and substrate materials. (d) Conductance peaks measured as a function of potential (Vr in Fig. 1a) for streptavidin on Pd electrodes. Error bars in c and d are uncertainties in fits to the conductance distributions.
