Fig. 6.
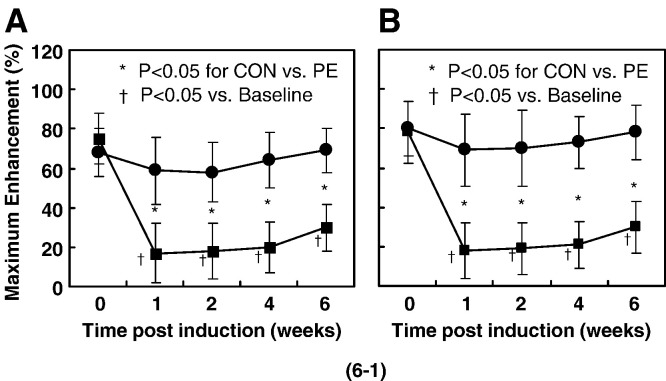
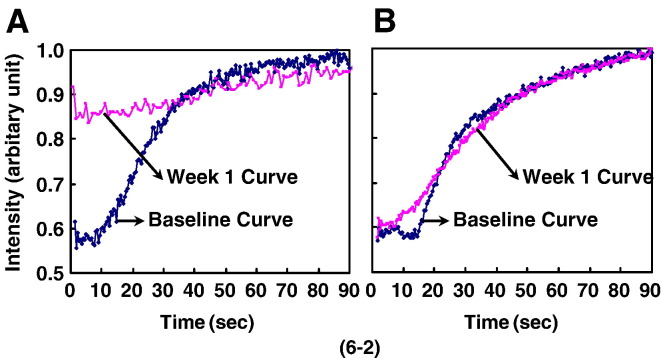
(6-1) Blood perfusion assessed by dynamic MRI with significant difference in changes of curve pattern over time between the CON group and the PE group (P < 0.05). Maximum Enhancement at the examined sites (both proximal femur for A and distal femur for B) showed a significant decrease from baseline (P < 0.05) in the CON group at week 1 after LPS injection, then plateaued from week 1 to week 2 after LPS injection and increased moderately thereafter. With different patterns, no significant decrease was revealed in the PE group after LPS injection. (6-2) Representative Time-Intensity Curves derived from contrast-enhanced dynamic MRI on proximal femur. A: Maximum Enhancement showed a significant decrease from baseline in the CON group at week 1 after LPS injection. B: No significant decrease was found from the baseline in the PE group at week 1 after LPS injection.


