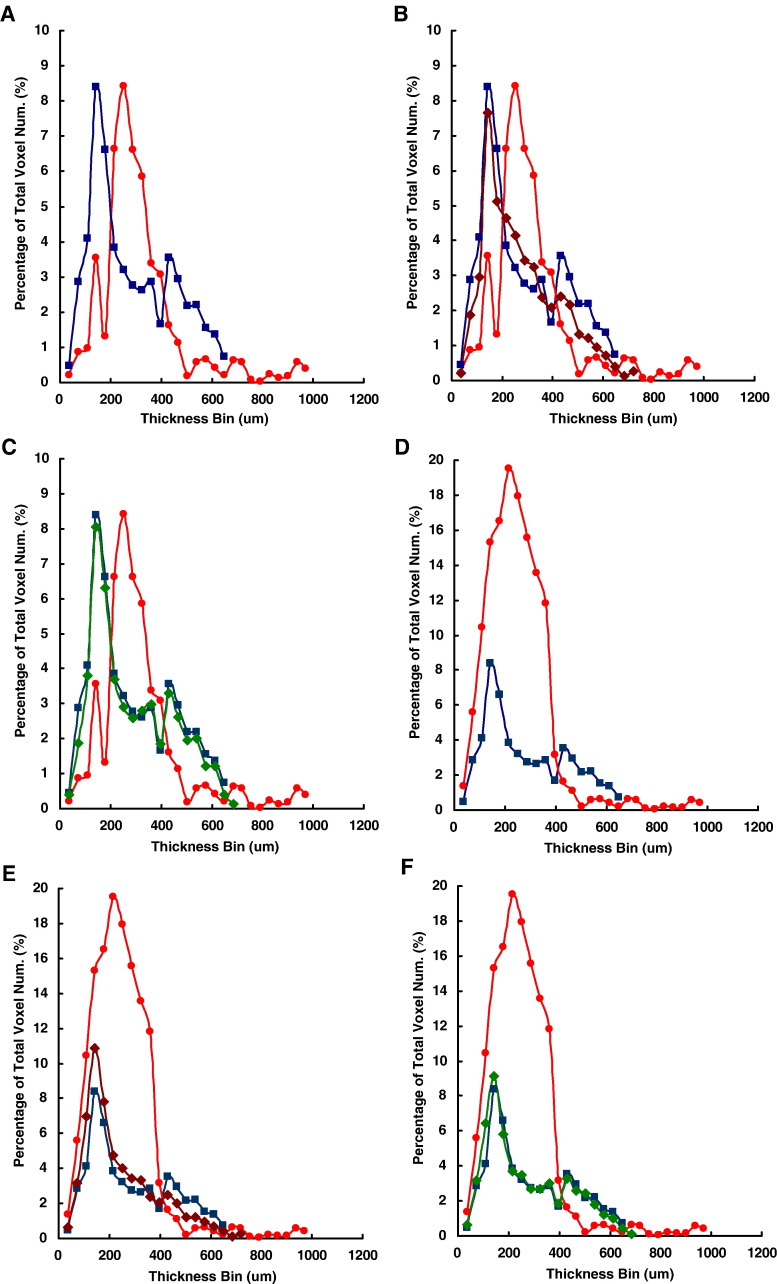
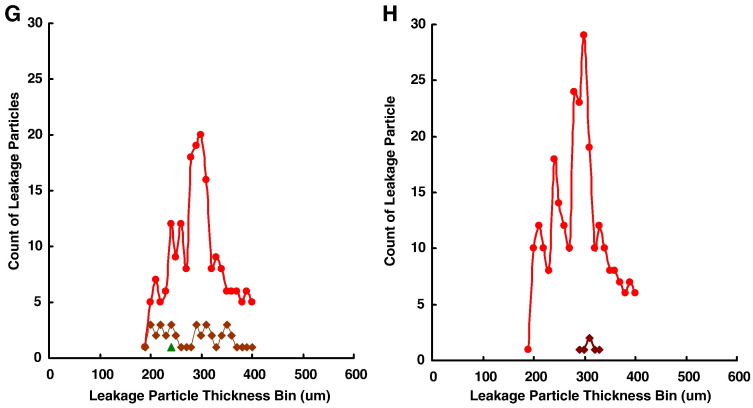
Fig. 7.
Representative histograms of angiographic structural units from micro-CT-based angiography and representative histograms of extravascular leakage particles during perfusion for micro-CT-based angiography. (A) In the CON group, angiographic structural units ranging from 400 to 600 µm or 36–200 µm were less prevalent at week 1 post-induction than at baseline, whereas angiographic structural units ranging from 200 to 400 µm were more at week 1 post-induction than at baseline. (B) Angiographic structural units ranging from 36 to 200 µm or 400–600 µm were slightly less in the L-ICT group at week 1 post-induction than at the baseline. (C) No difference in the pattern of angiographic structural units between the baseline before induction and the H-ICT group at week 1 post-induction. (D) Angiographic structural units ranging from 400 to 600 µm were less prevalent in the CON group at week 2 post-induction than at the baseline, whereas angiographic structural units ranging from 36 to 200 µm were more prevalent in the CON group at week 2 post-induction than at the baseline. (E) Angiographic structural units ranging from 400 to 600 µm were slightly lower in the L-ICT group at week 2 post-induction than that at baseline, whereas angiographic structural units ranging from 36 to 200 µm were slightly prevalent than at the baseline. (F) No difference in the pattern of angiographic structural units between the baseline and the H-ICT group at week 2 post-induction. Representative histograms of extravascular leakage particles mainly ranged from 200 to 400 µm. Extravascular leakage particles were found more in the CON group compared to those in either the H-ICT or L-ICT group at week 1 (G) and week 2 post-induction (H). Note: Red circle indicates the CON group at week 1 post-induction, blue square indicates baseline before induction, brown rhombus indicates the L-ICT group, and green rhombus indicates the H-ICT group.


