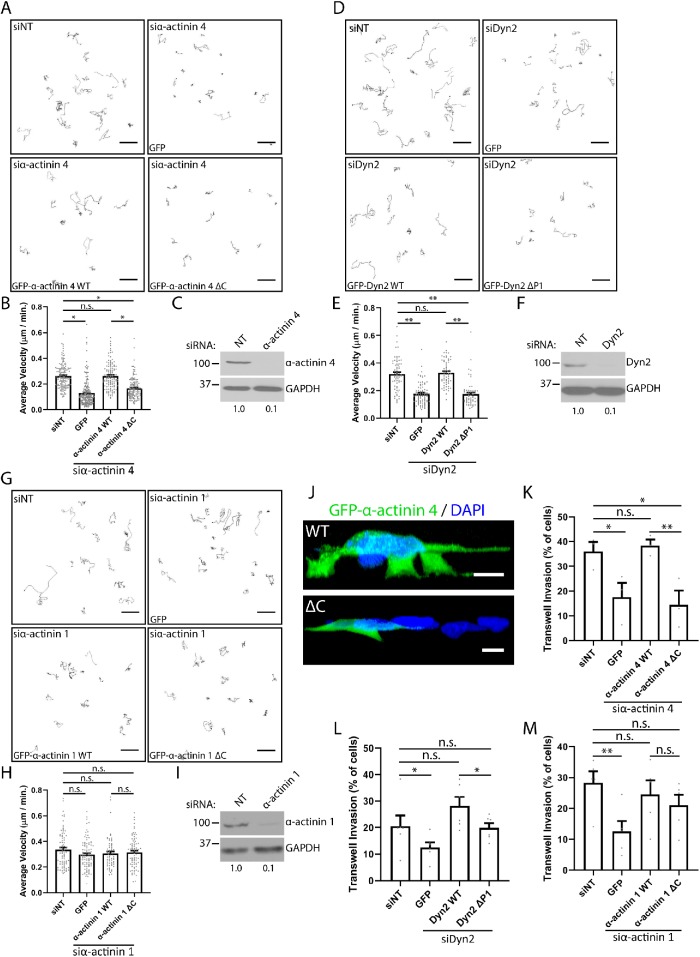
FIGURE 4:
The interaction between Dyn2 and α-actinin 4 is required for 2D and invasive migration of PDAC cells. (A–I) The velocity of PANC-1 cells during 2D migration was quantified after knockdown of α-actinin 4 (A, B), Dyn2 (D, E), or α-actinin 1 (G, H) and reexpression of the WT or binding mutant protein. Representative cell tracks are shown for each condition, with each path representing a single cell. Graphed data represent the mean ± SEM, and data points represent individual cells. n = 3 independent experiments, with between 62 and 192 cells quantified across all experiments. Western blots showing the efficiency of siRNA knockdown for α-actinin 4 (C), Dyn2 (F), and α-actinin 1 (I) are shown, and values below blots represent quantification from densitometry. (J–M) Transwell migration assays were performed to measure the ability of PANC-1 cells to undergo invasive migration after manipulating α-actinin– Dyn2 binding. Reconstructions of z-stack images of PANC-1 cells expressing either GFP–α-actinin 4 WT or GFP–α-actinin 4 ΔC invading through transwell filters are shown (J). Transwell invasion efficiency was quantified after knockdown of α-actinin 4 (K), Dyn2 (L), or α-actinin 1 (M) and reexpression of the WT or binding mutant protein. Graphed data represent the mean ± SEM, and data points represent average values for each experiment. α-Actinin 4: n = 3 biological replicates, between 334 and 549 cells per condition in each experiment. α-Actinin 1: n = 5 biological replicates, between 132 and 538 cells per condition in each experiment. Dyn2: n = 6 biological replicates, between 167 and 581 cells per condition in each experiment. Scale bars: 50 μm (A, D, G), 10 μm (J). Student’s t test was used to measure statistical significance. * indicates p < 0.05; ** indicates p < 0.01.

