FIGURE 7:
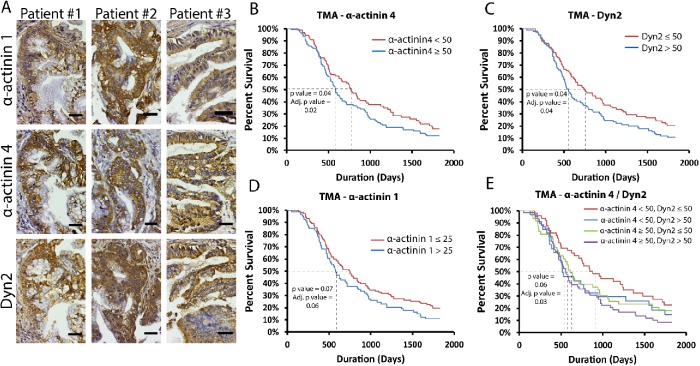
Dyn2 and α-actinin 4 overexpression in PDAC patients is correlated with worse prognosis. (A) Immunohistochemistry of tissue microarray (TMA) slides shows the localization of α-actinin 1 and 4, and Dyn2 in human PDAC tissue. Serial sections of primary PDAC tumors from three unique patients are shown. Both α-actinin isoforms and Dyn2 are expressed in the neoplastic ducts. (B–D) Kaplan Meier survival curves were generated based on the expression of α-actinin 4 (B), Dyn2 (C), and α-actinin 1 (D) in 205 PDAC patient tissue cores represented in the TMA slides. H-scores were calculated based on intensity and extent of the staining, and patients were stratified into groups based on the median H-score value, which are listed in the graph legends. (E) Patients were further grouped into four categories based on the expression of both α-actinin 4 and Dyn2, stratified by the H-scores listed in the graph legend. Scale bars: 25 μm. Likelihood ratio test was used to measure statistical significance; adjusted p values take into account patient demographics (age at diagnosis, sex, obesity [BMI ≥ 30], and patient-reported diabetes).

