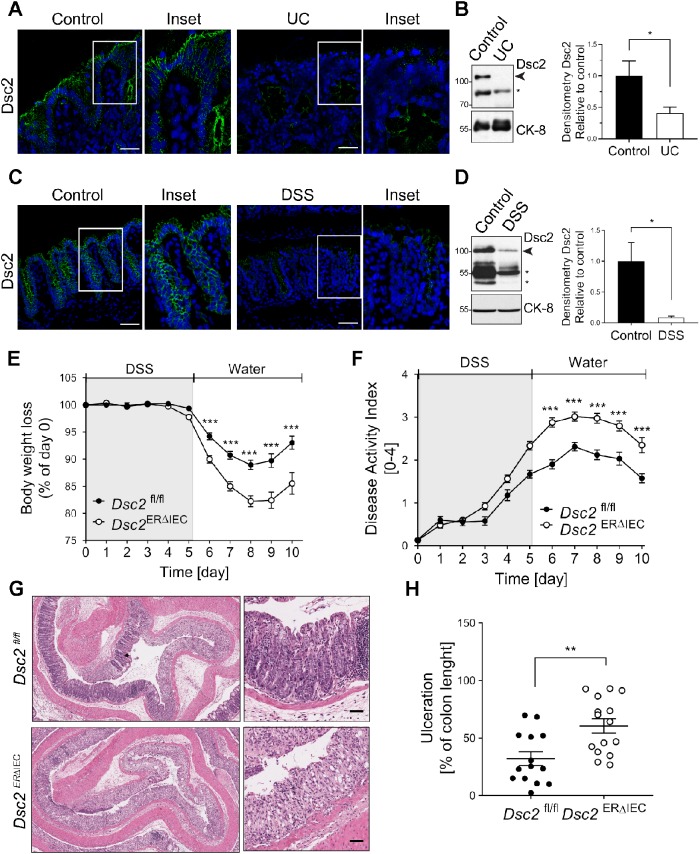
FIGURE 2:
Dsc2 is decreased in human and mouse inflamed colon, and its loss resulted in delayed mucosal recovery from colitis. (A) Representative images of IF staining of Dsc2 (green) and DAPI (blue) in frozen sections of human colonic tissues from patients with UC and healthy controls. Reduction of fluorescence intensity for Dsc2 in UC compared with control. Scale bars: 50 μm. (B) Western blot (WB) and densitometry analysis of the expression of Dsc2 and loading control Cytokeratin-8 (CK-8) in human colonic tissues from patients with UC and healthy controls. WB images are representative of two individual experiments with 10 controls and nine UC samples. Arrowhead: Full-length Dsc2; asterisk: cleaved Dsc2. Bar graphs represent densitometric values of seven healthy controls and six UC samples and are normalized to control. Data are mean ± SEM. Significance is determined by two-tailed Student’s t test. *p ≤ 0.05. (C, D) Reduced expression of Dsc2 in inflamed colonic mucosa from DSS-treated wild-type C57BL/6 mice at day 7 of DSS treatment (5 d DSS followed by 2 d of water) by IF and WB. (C) Representative IF images of frozen sections of colon tissue from DSS-treated mice vs. untreated controls. Dsc2 (green) and DAPI (blue). Reduction of fluorescence intensity for Dsc2 in DSS compared with control. Scale bars: 50 μm. (D) Representative WB images and densitometry analysis of the expression of Dsc2 and CK-8 in colon from DSS-treated mice vs. untreated controls. Arrowhead: Full-length Dsc2; asterisk: cleaved Dsc2. Bar graphs represent values of three individual mouse per group and normalized to controls. Data are mean ± SEM. Significance is determined by two-tailed Student’s t test. *p = 0.04. (E–H) Age- and sex-matched Dsc2ERΔIEC and littermate control (Dsc2fl/fl) mice were used 4 wk after the last tamoxifen injection and then subjected to DSS-induced colitis by administration of 2.5% DSS for 5 d followed by regular drinking water for 5 d to promote mucosal recovery. Dsc2ERΔIEC are more susceptible to colitis and present delayed recovery from colitis, as reflected by (E) significantly greater body weight loss and (F) higher values of DAI, compared with Dsc2fl/fl mice. (E, F) Data are combined values of three independent experiments (30 mice per group) and are expressed as mean ± SEM. Significance is determined by two-way ANOVA. ***p ≤ 0.001. (G) Representative images of H&E staining of section of Swiss roll mounts of the distal colon of Dsc2ERΔIEC mice compared with controls at day 10. Scale bars: 200 μm. (H) Percentage of injury/ulceration that represents the ratio of the length of injured/ulcerated areas (≥50% crypt loss) relative to the entire colon length showing more mucosal ulcerations in Dsc2ERΔIEC mice compared with controls. Dots represent individual mice. Data are combined from three independent experiments (14–15 mice per group) and expressed as mean ± SEM. Significance is determined by two-tailed Student’s t test. **p = 0.003.

