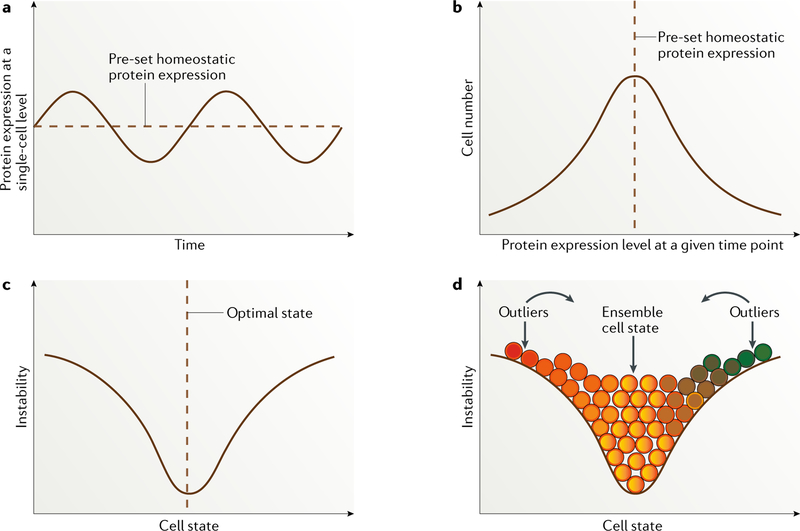
Fig. 1 |. Dynamic fluctuation model.
a | Dynamically fluctuating expression pattern of a given protein longitudinally at the single-cell level. b | Cell distribution based on expression levels of a particular protein, with the vast majority of cells located around the predefined homeostatic protein expression level. c | Cell state defined by a particular protein or a group of correlated proteins entangled within a regulatory pathway, with the majority of cells located at the optimal ensemble state. The more distant from this pre-set state a cell is, the more unstable it is likely to be, with a strong tendency to switch back to the point of homeostatic balance. d | Distribution of cells of different states (depicted in different colours). Continuous colour changes indicate that cell-state transitions occur across a spectrum. Unlike the perfectly symmetric distribution shown, the cell-state curve varies for proteins that define different cell states. Immortalized melanoma cells are probably skewed towards one end of the spectrum in a context-dependent way. Importantly, unstable outliers are in a cell state that differs substantially from the majority of the cell population and are therefore expected to behave differently in a given situation, such as stress.

