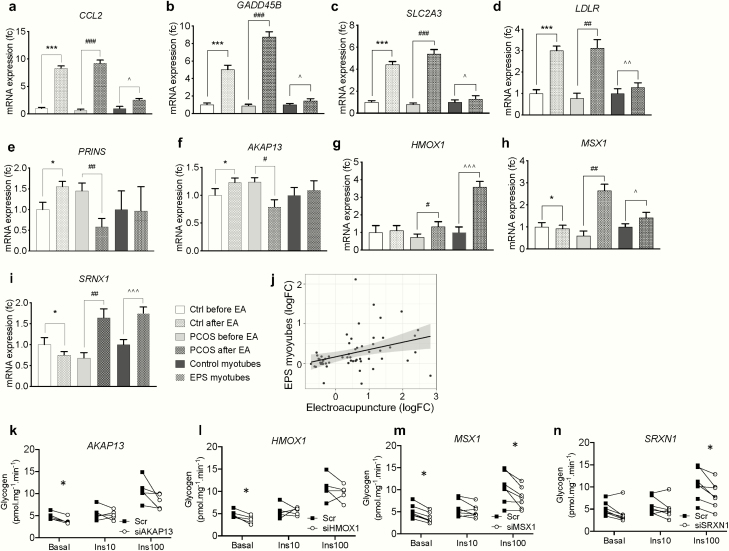
Figure 6.
Twenty-five percent of validated genes were upregulated in response to electrical stimulation in women with and without PCOS, and in myotubes following EPS. (a-d) Effect of electrical stimulation on genes with the largest changes in mRNA expression in PCOS, controls and myotubes (targeted approach); CCL2, GADD45B, SLC2A3, LDLR. (e-i) Genes regulated in opposite directions in response to electrical stimulation in PCOS (n = 15) and controls (n = 14); PRINS, AKAP13, HOMOX1, MSX1, SRNX1. *P < 0.05, ***P < 0.001 vs control before EA, #P < 0.05, ##P < 0.01, ###P < 0.001 vs PCOS before EA, ∧P < 0.05, ∧∧P < 0.01, ∧∧∧P < 0.001 vs unstimulated myotubes, data were analyzed by Student t test and presented as mean ± SEM. All investigated genes in this targeted approach are presented in Supplementary Table S1 (30). (j) Correlation of fold-changes of genes significantly modified in myotubes following EPS (P < 0.05) with genes changed in women by electroacupuncture. Spearman r = 0.46, P < 0.001. (k-n) Insulin stimulated glycogen incorporation in myotubes from healthy controls after gene silencing using siRNA for AKAP13, HMOX1, MSX1, SRXN1 (n = 5-7). Data were analyzed by two-way ANOVA and presented as individual values, *P < 0.05 vs scramble control at baseline, and after 10 nM and 100 nM insulin stimulation.

