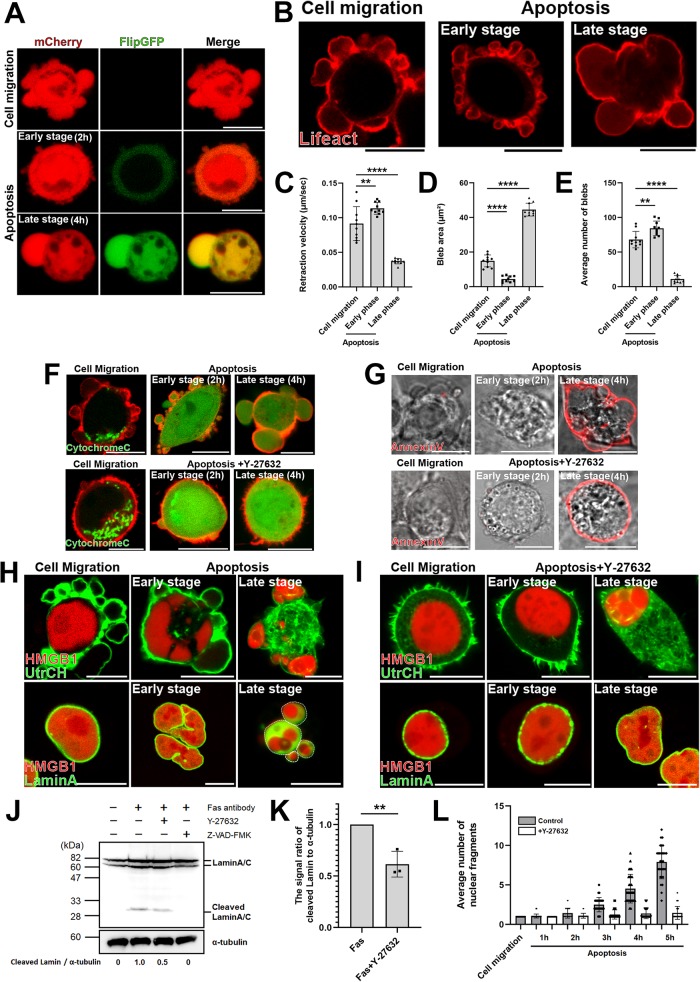
FIGURE 1:
The dynamic behavior of membrane blebs changes with the progression of apoptosis. (A) Migratory blebs and apoptotic blebs of DLD1 cells stably expressing FlipGFP(casp3)-T2A-mCherry, a GFP-based fluorogenic caspase-3 reporter. When DLD1 cells were seeded on Type I Collagen gel, they actively formed blebs and moved around freely (top). DLD1 cells were treated with 250 ng/ml anti-Fas antibody and 10 mg/ml cycloheximide for 2 h (Early stage) or 4 h (Late stage) to induce apoptosis (bottom). Results shown are representative of three independent experiments. Scale bar, 10 μm. (B) DLD1 cells were transfected with Lifeact-RFP. DLD1 cells actively formed blebs and moved around freely (left). DLD1 cells were treated with 250 ng/ml anti-Fas antibody and 10 mg/ml cycloheximide for 2 h (Early stage) or 4 h (Late stage) to induce apoptosis (right). Results shown are representative of five independent experiments. Scale bar, 10 μm. (C) The retraction velocities of membrane blebs in freely moving DLD1 cells and apoptotic DLD1 cells were quantified. The speed of the retraction phase of membrane blebs of apoptotic cells in the late stage was slower than that in early stage. Error bars indicate the SD calculated based on the values from N = 10 independent blebs. **P < 0.01, ****P < 0.0001 (one-way analysis of variance [ANOVA]). (D) The sizes of membrane blebs in freely moving DLD1 cells and apoptotic DLD1 cells were quantified. The size of membrane blebs of apoptotic cells in the late stage was significantly larger than that in early stage. Error bars are SD of N = 10 independent blebs. ****P < 0.0001 (one-way ANOVA). (E) The frequencies of membrane blebs in freely moving DLD1 cells and apoptotic DLD1 cells during 10 min were quantified. The number of blebs formed during 10 min in apoptotic cells in the late stage was significantly fewer than that in early stage. Error bars are SD of N = 10 independent blebs. **P < 0.01, ****P < 0.0001 (one-way ANOVA). (F) (Top panel) Membrane blebbing of DLD1 cells transfected with Cytochrome C-GFP and Lifeact–RFP from the early stage to the late stage of apoptosis. Cells were treated with 250 ng/ml anti-Fas antibody and 10 mg/ml cycloheximide for 2 h (Early stage) and 4 h (Late stage). Bottom panel: membrane blebbing of DLD1 cells transfected with Cytochrome C-GFP and Lifeact–RFP from the early stage to the late stage of apoptosis under ROCK inhibition. Cells were treated with 250 ng/ml anti-Fas antibody, 10 mg/ml cycloheximide, and 10 µM Y-27632 for 2 h (Early stage) and 4 h (Late stage). Results shown are representative of three independent experiments. Scale bar, 10 μm. (G) Top panel: Membrane blebbing of DLD1 cells stained with AnnexinV-Cy3 from the early stage to the late stage of apoptosis. Cells were treated with 250 ng/ml anti-Fas antibody and 10 mg/ml cycloheximide for 2 h (Early stage) and 4 h (Late stage). Bottom panel: membrane blebbing of DLD1 cells stained with AnnexinV-Cy3 from the early stage to the late stage of apoptosis under ROCK inhibition. Cells were treated with 250 ng/ml anti-Fas antibody, 10 mg/ml cycloheximide and 10 µM Y-27632 for 2 h (Early stage) and 4 h (Late stage). Results shown are representative of three independent experiments. Scale bar, 10 μm. (H) Top panel: membrane blebbing of DLD1 cells transfected with the calponin homology domain of utrophin (UtrCH)-GFP, a filamentous actin marker, and HMGB1-mScarlet from the early stage to the late stage of apoptosis. Cells were treated with 250 ng/ml anti-Fas antibody and 10 mg/ml cycloheximide for 2 h (Early stage) and 4 h (Late stage). Bottom panel: membrane blebbing of DLD1 cells transfected with LaminA–GFP and HMGB1-mScarlet from the early stage to the late stage of apoptosis. Cells were treated with 250 ng/ml anti-Fas antibody and 10 mg/ml cycloheximide for 2 h (Early stage) and 4 h (Late stage). White broken lines indicate margin of large blebs formed during the late phase of apoptosis. Results shown are representative of three independent experiments. Scale bar, 10 μm. (I) Top panel: membrane blebbing of DLD1 cells transfected with UtrCH-GFP and HMGB1-mScarlet from the early stage to the late stage of apoptosis under ROCK inhibition. Cells were treated with 250 ng/ml anti-Fas antibody, 10 mg/ml cycloheximide, and 10 µM Y-27632 for 2 h (Early stage) and 4 h (Late stage). Scale bar, 10 μm. Bottom panel: membrane blebbing of DLD1 cells transfected with LaminA-GFP and HMGB1-mScarlet from the early stage to the late stage of apoptosis under ROCK inhibition. Cells were treated with 250 ng/ml anti-Fas antibody, 10 mg/ml cycloheximide, and 10 µM Y-27632 for 2 h (Early stage) and 4 h (Late stage). Results shown are representative of three independent experiments. Scale bar, 10 μm. (J) DLD1 cells were left untreated or treated with 250 ng/ml anti-Fas antibody and 10 mg/ml cycloheximide for 4 h to induce apoptosis, either in the absence or in the presence of 10 µM Y-27632 or 50µM Z-VAD-FMK as indicated. Lysates were run on 10% SDS–PAGE and immunoblotted with anti-LaminA/C and α-tubulin antibodies. Cleaved LaminA/C and α-tubulin signals were quantified by densitometry to derive the ratio of cleaved LaminA/C to α-tubulin. The signal ratio of DLD1 cells treated with anti-Fas antibody and cycloheximide only (lane 2) was set to 1. Results shown are representative of three independent experiments. (K) The quantified means from N = 3 independent experiments of the signal ratio of cleaved LaminA/C to α-tubulin shown in J. Error bars indicate the SD. **P < 0.01 (Student’s t test). (L) Quantitative analysis of changes in the number of nuclear fragments labeled with HMGB1-mScarlet from the early stage to the late stage of apoptosis. Cells were treated with 250 ng/ml anti-Fas antibody and 10 mg/ml cycloheximide with or without 10 µM Y-27632 for 5 h. The number of HMGB1-mScarlet fragments were counted every hour. The SD was calculated based on the values from N = 30 independent cells.

