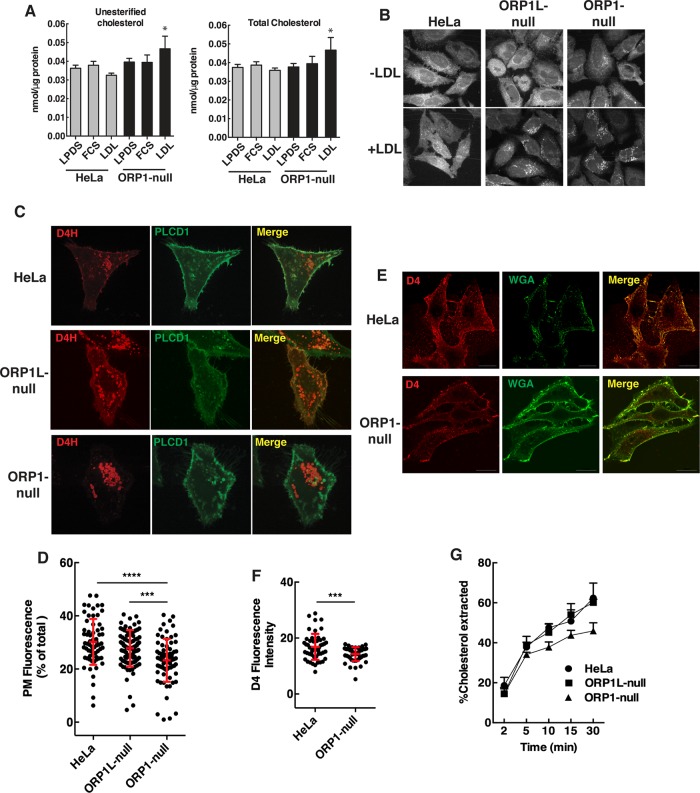
FIGURE 2:
Cholesterol mass and localization in ORP1-null cells. (A) Total and unesterified cholesterol mass was measured in cells cultured in FCS, LPDS, or LPDS plus 50 µg/ml human LDL (mean and SD of four experiments; *p < 0.05 compared with matched HeLa cell controls). (B) Filipin fluorescence was imaged in cells cultured in LPDS (-LDL) or LPDS plus LDL (50 µg/ml) for 16 h. (C) Live cell confocal imaging of HeLa and ORP1-null cells coexpressing Cherry-D4H and PH-PLCD1-GFP-PH for 24 h. (D) Quantification of Cherry-D4H fluorescence in the PM of HeLa, ORP1L-null, and ORP1S-null cells from C. Scatter plots (mean and SD) are shown for three experiments involving 65–100 cells (one-way analysis of variance [ANOVA] with Tukey’s multiple comparison, ***p < 0.001, ****p < 0.0001). (E) Hela and ORP1-null cells were fixed and incubated with Alexa Fluor 488-WGA and recombinant GFP-D4H. Images were captured by confocal microscopy. (F) Quantitation of GFP-D4H fluorescence intensity per cell from the images in E. Results (mean and SD) are from analysis of 50–60 cells (unpaired t test, ***p < 0.001). (G) The percentage of extraction of [3H]cholesterol by 1 mM cyclodextrin from HeLa, ORP1-null, and ORP1L-null cells. Results are the mean SD for a representative experiment repeated two other times with similar results.

