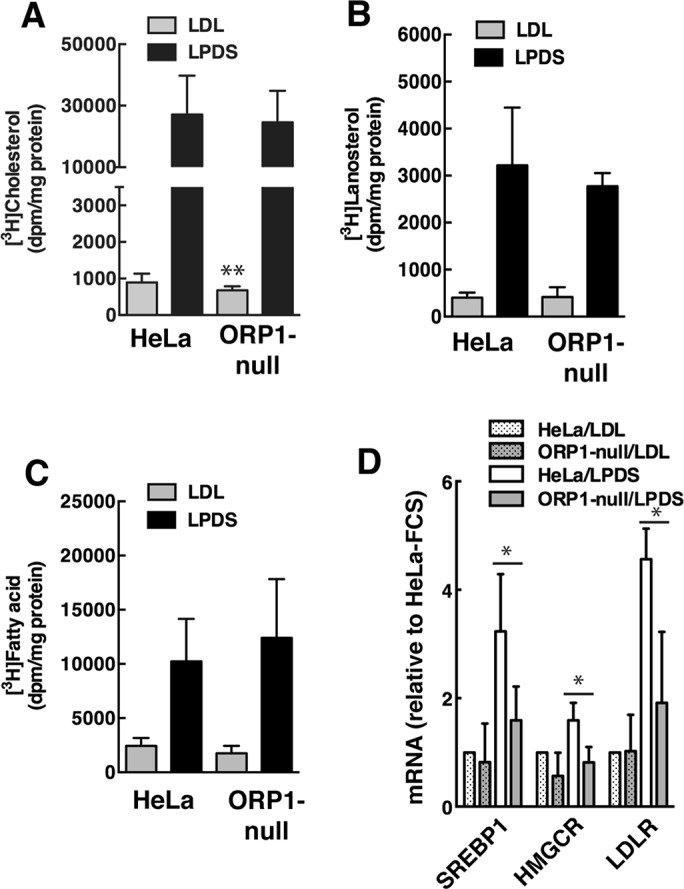
FIGURE 5:

Cholesterol regulation in ORP1-null cells. (A–C) [3H]acetate incorporation into cholesterol (A), lanosterol (B) and fatty acids (C) was measured in HeLa and ORP1-null cells cultured in FBS or LPDS. Results are the mean and SD of 3 experiments (**p < 0.01). (D) qPCR analysis of SREBP1, HMGCR, and LDLR expression in cells cultured in FCS or LPDS. Results are expressed relative to HeLa cells cultured in FBS, and are the mean and SD of 4 experiments (unpaired t test, *p < 0.05 compared with similarly treated HeLa cells).
