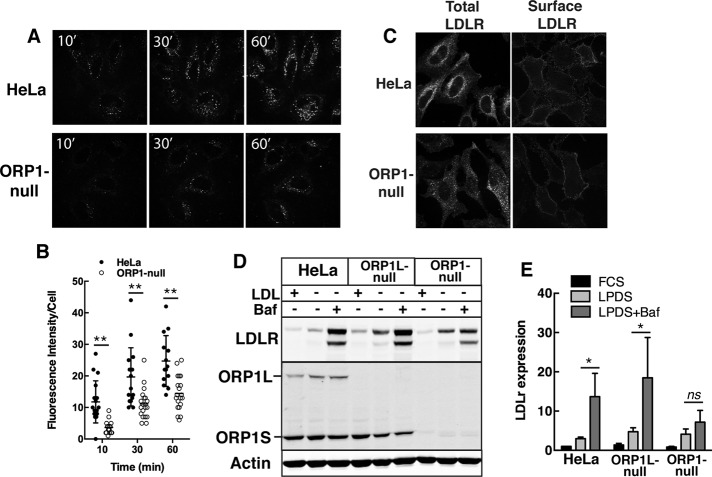
FIGURE 6:
Reduced LDL uptake in ORP1-null cells. (A, B) Spinning disk confocal images of HeLa and ORP1-null cells cultured with BODIPY-LDL. Uptake of BODIPY-LDL was quantified as fluorescence intensity per cell (bar, 20 µm). Scatter plots (mean and SD) are from three experiments (20–27 fields of cells in total, **p < 0.001). (C) Immunofluorescence of total and cell surface LDLR (0.8 μm confocal sections). (D) Immunoblot analysis of LDLR expression in cells cultured in DMEM with FCS, LPDS, or LPDS plus bafilomycin (100 nM for 6 h). (E) From immunoblots in D, LDLR expression was quantified relative to actin. Results are the mean and SD of four to five experiments (unpaired t test, *p < 0.05; ns, not significant).

