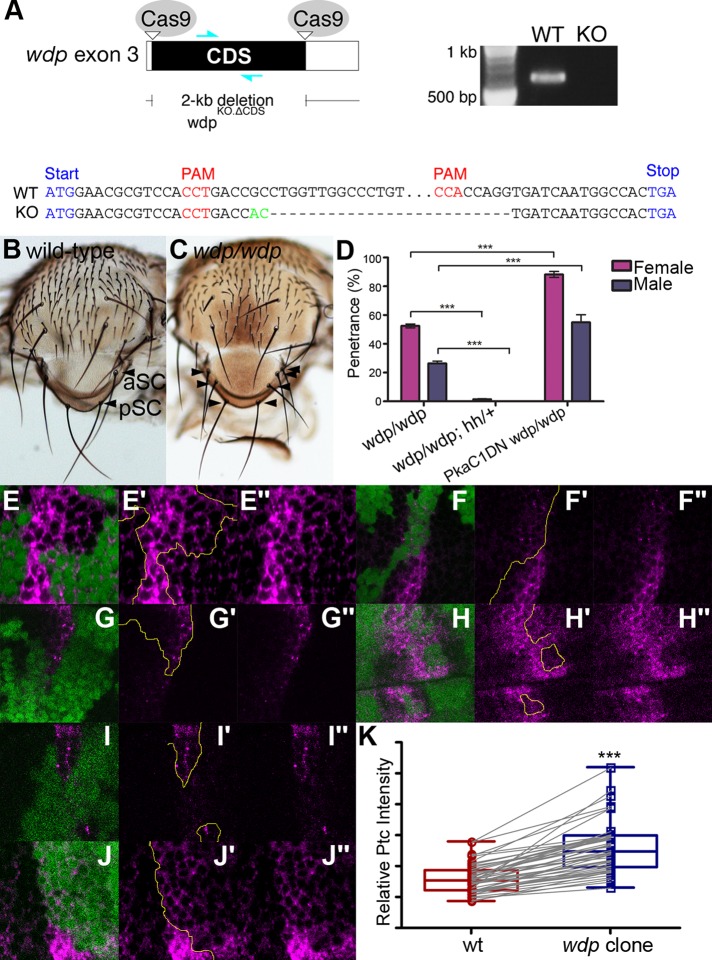
FIGURE 6:
The wdp mutant phenotypes. (A) Schematic of the generation of a wdp loss-of-function allele (wdpKO.ΔCDS) lacking most of the wdp CDS using the CRISPR–Cas9 system (top left). A primer set shown as cyan arrows was used for PCR-based genotyping (top right). The results are shown for the WT and wdpKO.ΔCDS allele (KO). Genomic sequencing of the wdp endogenous locus targeted by CRISPR–Cas9 showed a deletion of most of the wdp CDS (bottom). A small insertion is shown in green. (B, C) Control (WT; B) and wdp/wdp (C) SC bristles. Anterior and posterior SC bristles are marked (aSC and pSC, respectively). The wdp homozygous mutants show duplication or triplication of SC bristles (arrowheads). (D) Genetic interactions between wdp and hh or PKa-C1 on the notum phenotype. Penetrance of SC phenotypes is shown. Deleting one copy of hh in wdp homozygotes almost completely suppressed the SC phenotype (wdp/wdp; hhAC/+), while Pka-C1DN significantly enhanced it (Pka-C1DN wdp/wdp). The bristles were scored for at least 200 specimens per genotype. (E–J) Somatic mosaic clones of wdpKO were induced in the wing pouch using Act5C-GAL4 UAS-FLP. Homozygous wdpKO mutant cells are marked by loss of GFP (green) and discs were stained with anti-Ptc antibody (magenta). The clone borders are marked with yellow lines. Increased Ptc expression was observed in wdp mutant clones. Zoom-out images of two wing discs bearing three wdp mutant clones for 6F, G, and H are shown in Supplemental Figure S5 to indicate the relative positions of these clones in the wing disc. (K) Boxplots showing the effect of wdp clones on Ptc staining signal intensity. Ptc staining signal intensity in randomly selected wdp mutant clones was compared with that in immediate neighboring WT cells (n = 49 pairs). ***p < 0.001. The Wilcoxon rank sum test was used to compare two paired samples.

