FIGURE 1:
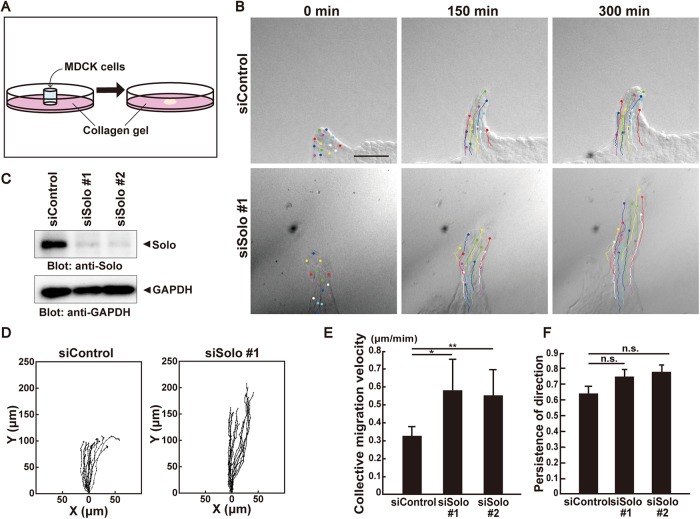
Solo knockdown accelerates collective cell migration. (A) Schematic representation of the collective cell migration assay on collagen gel. For further details, see Materials and Methods. (B) Differential interference contrast (DIC) images of finger-like protrusions comprised of control or Solo siRNA-transfected MDCK cells at 0, 150, and 300 min after the start of observation. Trajectories of individual cells were overlaid. Scale bar = 100 μm. (C) Effect of Solo knockdown on endogenous Solo expression in MDCK cells. Cells were transfected with control or Solo-targeting siRNAs and incubated for 48 h. Cells were harvested, lysed, and analyzed by immunoblotting with anti-Solo antibody. (D) Trajectories of individual cells in the protrusions in B. Cells were tracked every 10 min for 5 h. Intersection of the x- and y-axes was taken as the position of the cell nucleus at the starting point. (E) Velocities of the collective migration of the control and Solo-knockdown cells are shown as average velocities of the tracked cells in each condition. (F) Persistence of direction of individual migrating cells in the control and Solo-knockdown protrusions is represented as the distance between the starting and ending points divided by the length of trajectory. A value close to 1 indicates that the cells maintain their direction and positional relation to the rest of the cell population during migration. Cell tracks are representative of four independent experiments. In E and F, data are means ± SD of three independent experiments (≥10 cells/experiment). *, P < 0.05; **, P < 0.01 (one-way ANOVA followed by Dunnett’s test).

