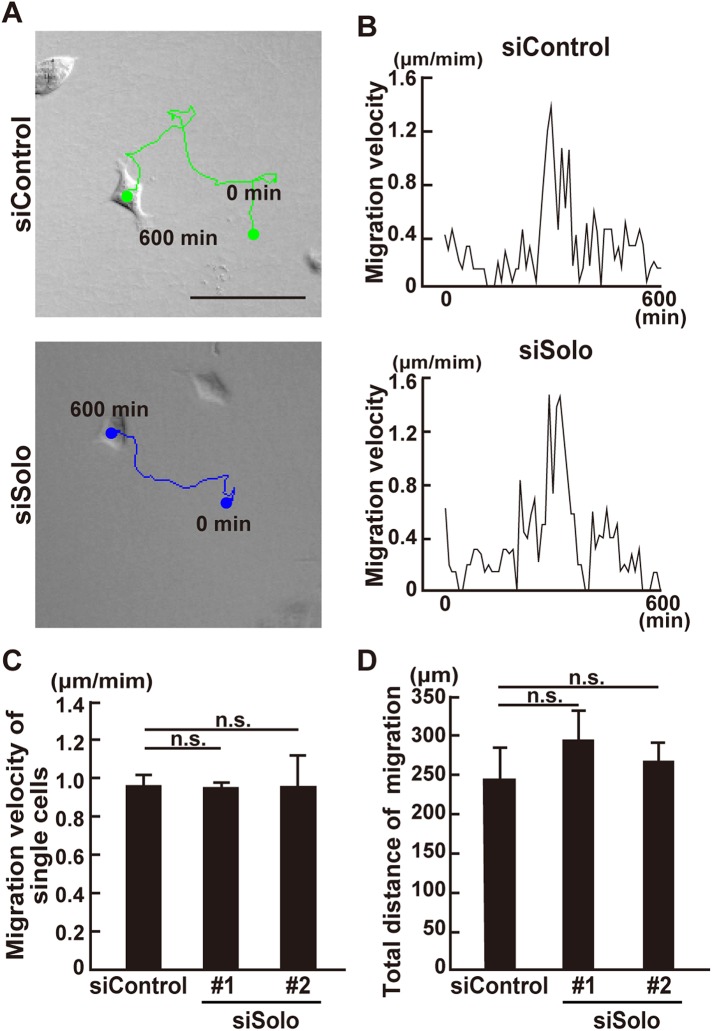
FIGURE 2:
Effect of Solo knockdown on solitary MDCK cell motility. (A) DIC images of control and Solo-knockdown migrating solitary MDCK cells on collagen gel at the last frame. Cells were transfected with control or Solo-targeting siRNAs, incubated for 24 h, and seeded at low cell density on collagen gel. After overnight incubation, the cells were observed every 10 min for 10 h. Positions of the nuclei were tracked and their trajectories were overlaid. Scale bar = 100 μm. (B) Lengths of the cell migration paths during each 10 min period. (C) Migration velocities of control and Solo-knockdown solitary cells. Values were calculated by averaging the velocities when the cells migrate at >0.5 μm min−1 for >30 min. (D) Total migratory distance of the control and Solo-knockdown solitary cells for 10 h. Data are means ± SD of three independent experiments (8–26 cells/experiment). n. s., not significant (one-way ANOVA followed by Dunnett’s test).

