FIGURE 3:
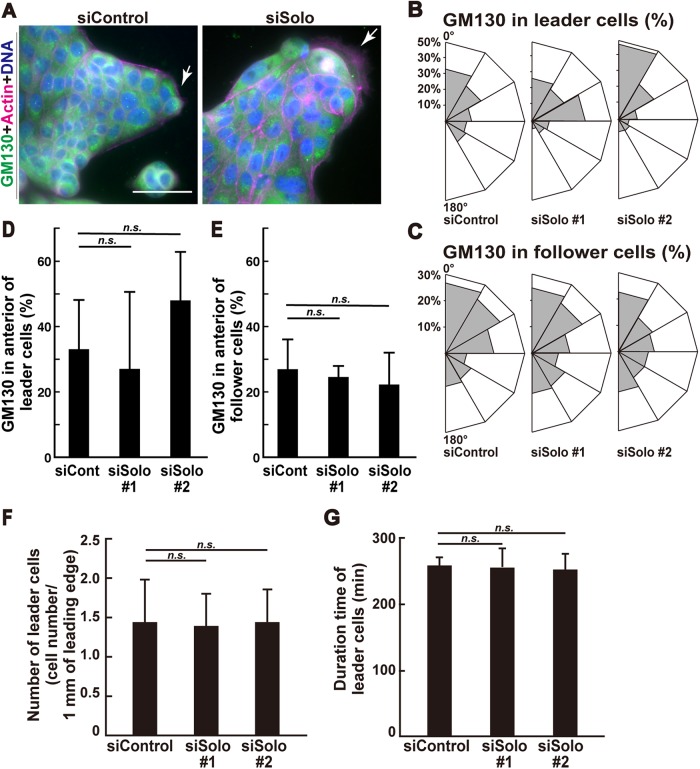
Effects of Solo knockdown on cell polarity and leader cell characteristics in the protrusions. (A) Immunofluorescence images of F-actin, Golgi apparatus, and nuclei in control and Solo-knockdown cells in finger-like protrusions. Collectively migrating cells on collagen gel were fixed and stained with anti-GM130 antibody for Golgi (green), Alexa Fluor 568–phalloidin for F-actin (red), and DAPI for nucleus (blue). Arrows indicate leader cells. Scale bar = 50 μm. (B, C) Angular distributions showing percentage of control or Solo-knockdown leader cells (B) or follower cells (C) whose Golgi apparatus were located within six equal sections (indicated as the total percentage of the left and right sides). Migration direction is indicated as 0°. (D, E) Percentage of leader cells (D) or follower cells (E) whose Golgi apparatus were located within 30° of the front sides in B and C. (F) Number of leader cells within 1 mm length of the edge around the control or Solo-knockdown protrusions. (G) Duration of leader cells in the control or Solo-knockdown protrusions. Life spans of leader cells were measured by time-lapse observation. Data are means ± SD of three independent experiments (48–78 cells/experiment). n. s., not significant (one-way ANOVA followed by Dunnett’s test).

