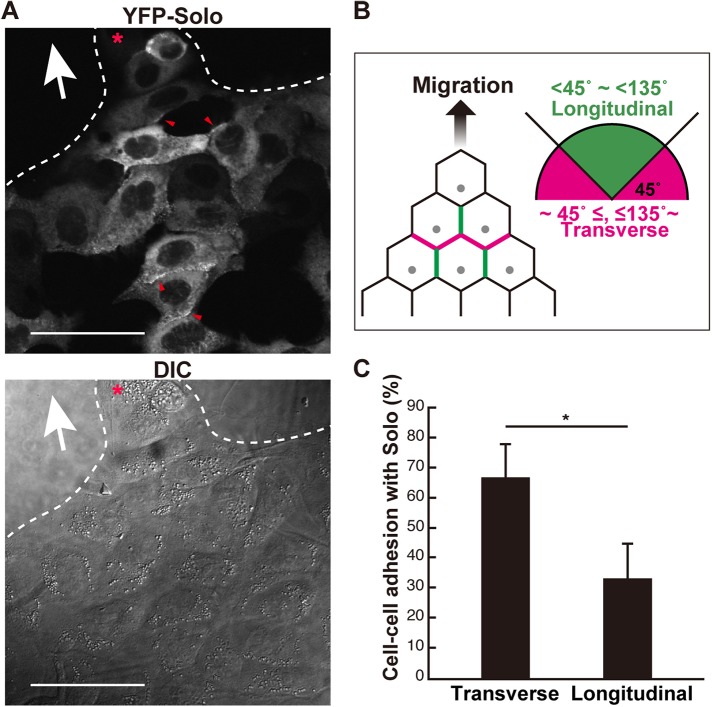
FIGURE 4:
Polarized Solo localization at the cell–cell contact sites during collective cell migration. (A) DIC and confocal microscopic fluorescence images of YFP-Solo–expressing MDCK cells. Collectively migrating YFP-Solo–expressing MDCK cells were fixed and the localization of YFP-Solo at the cell–cell contact sites was visualized in a single plane of cross-sectional images. Red arrowheads indicate Solo accumulation at the cell–cell contact sites. The red asterisk indicates the leader cell and the white arrow indicates the putative migration direction. Scale bars = 50 μm. (B) The longitudinal contact site was defined as its angle >45° and <135° relative to the migration direction (green lines). The transverse contact site is indicated by magenta lines. (C) The graph shows the rates of the transverse and longitudinal contact sites wherein YFP-Solo accumulated. Data are means ± SD of three independent experiments (25–47 cells/experiment in B). *, P < 0.05 (one-way ANOVA followed by Dunnett’s test).

