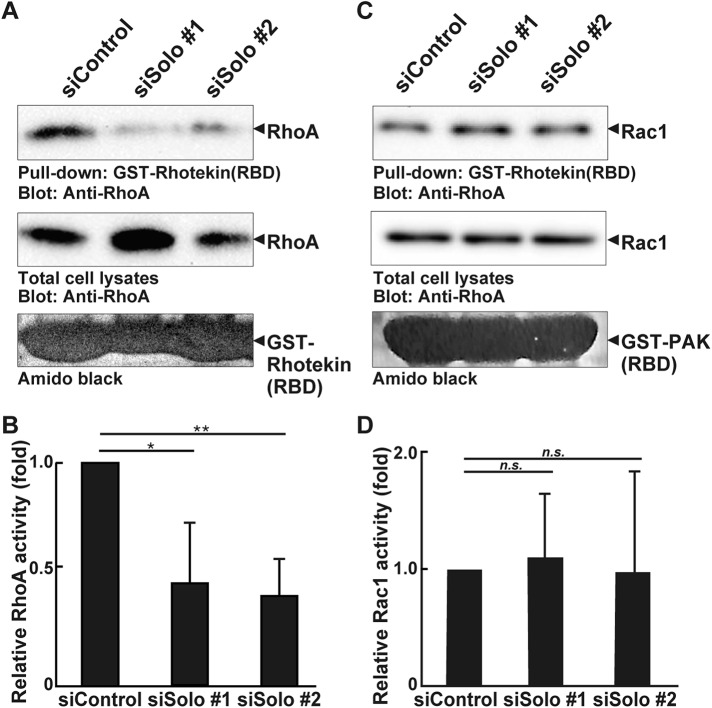
FIGURE 6:
Effects of Solo knockdown on RhoA and Rac1 activity in MDCK cells. (A, C) Control and Solo siRNA-transfected MDCK cells were incubated for 48 h until they formed a cell sheet. The cells were then lysed. Active RhoA and Rac1 were analyzed by GST pull-down assays using GST-rhotekin (RBD) and GST-PAK3 (PBD), respectively. (B, D) Relative RhoA and Rac1 activities are shown. The value of the control cells is taken as 1.0. Each value is the mean ± SD of four independent experiments. *, P < 0.05; **, P < 0.01; n.s., not significant (one-way ANOVA followed by Dunnett’s test).

