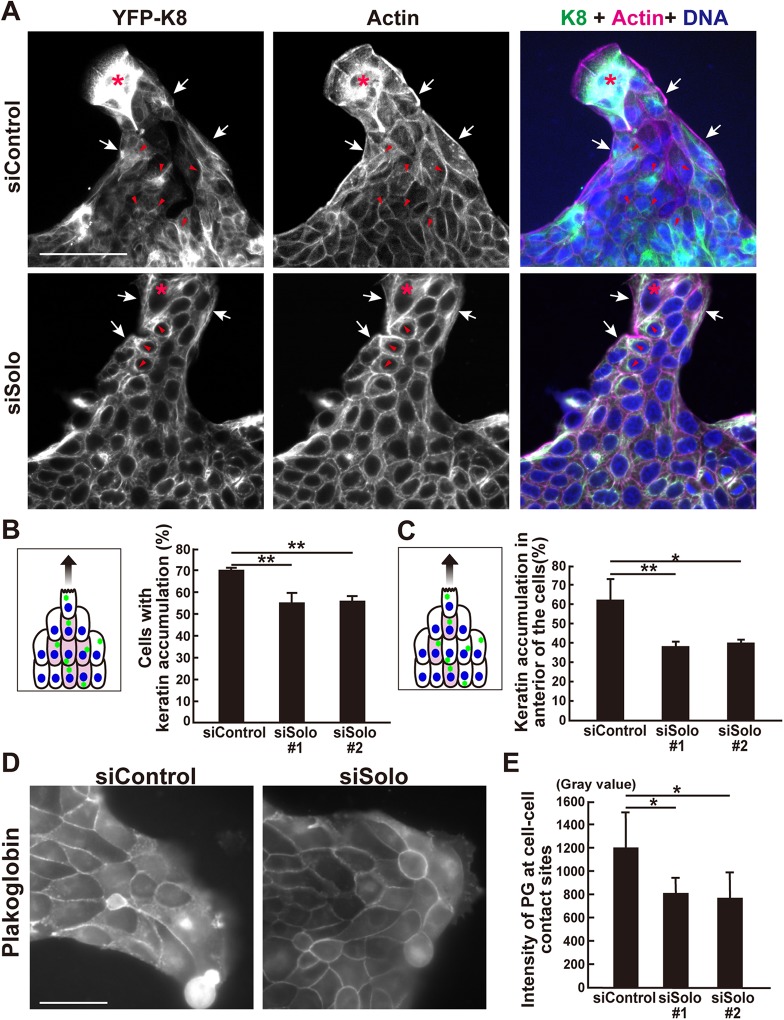
FIGURE 7:
Effects of Solo knockdown on K8/K18 filaments and plakoglobin localization during collective cell migration. (A) Immunofluorescence images of YFP-K8, F-actin, and nuclei in control and Solo-knockdown YFP-K8–expressing MDCK cells in the finger-like protrusions. The collectively migrating YFP-K8–expressing MDCK cells were fixed and the K8/K18 networks (green), F-actin (magenta), and nuclei (blue) were visualized. Accumulation of K8/K18 filaments in the peripheral and the interior cells are indicated by white arrows and red arrowheads, respectively. Asterisks indicate leader cells. Scale bar = 100 μm. (B) Schematic representation of K8/K18 accumulation (green dots) in the cells in the finger-like protrusion. Colored cells are the interior cells of the protrusion with K8/K18 accumulation. These were counted and the percentage of interior cells in the control- and Solo-knockdown finger-like protrusions are shown in the graph. (C) An interior cell was divided into four parts in a radial manner at 90° based on the migration direction axis and the cell center. The front section was defined as the front side. The model indicates that the colored cells in the interior area accumulated K8/K18 on the front side of the nucleus. The percentage of these interior cells in the control and Solo-knockdown finger-like protrusions are shown in the graph. (D) Immunofluorescence images of PG at the cell–cell contact sites in the control and Solo-knockdown finger-like protrusions. The cells were fixed and stained with anti-PG antibody. Scale bar = 50 μm. (E) PG intensities at the cell–cell contact sites of the control and Solo-knockdown cells. Data are mean ± SD of three independent experiments (60–140 cells/experiment in B and C; 100 cells in E). *, P < 0.05; **, P < 0.01 (one-way ANOVA followed by Dunnett’s test).

