
FIGURE 4:
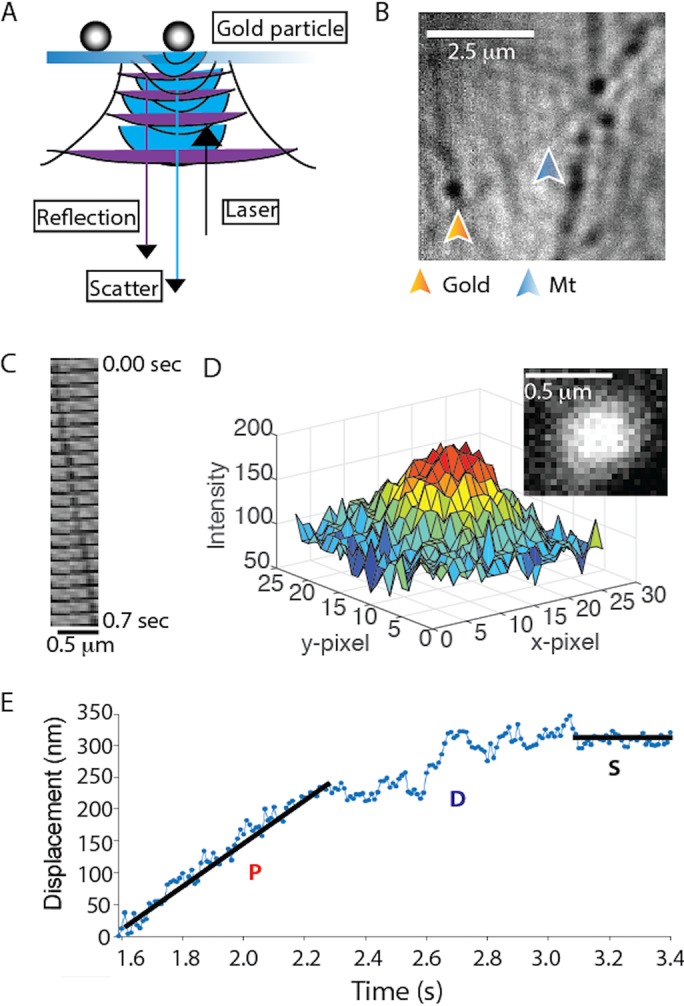
Single-molecule DDB tracking by iSCAT microscopy. (A) Diagram of iSCAT microscopy. Image is formed by scattered light from the gold nanoparticle (blue) interfering with reflected light from the glass–water interface (purple). (B) iSCAT image of a field of gold nanoparticle–labeled DDB bound to surface-immobilized microtubules. Image shown is generated from a raw image by flat fielding, which corrects inhomogeneous illumination across the field. (C) Montage of a gold particle–labeled DDB moving along an immobilized microtubule; each image is 35 msec apart. (D) Plot of pixel intensity of a gold nanoparticle (image in inset), which is fitted by a 2D Gaussian for subpixel localization. Image is generated by subtracting the image of the stationary microtubule (taken later in the video when no gold-labeled motor is present) and inverting the image to obtain a bright particle on a dark background. See also Supplemental Video S1. (E) Distance vs. time trace of a single DDB, demonstrating processive (P), diffusive (D), and stuck (S) episodes in the same trace. Lines represent linear regressions to hand-selected segments.