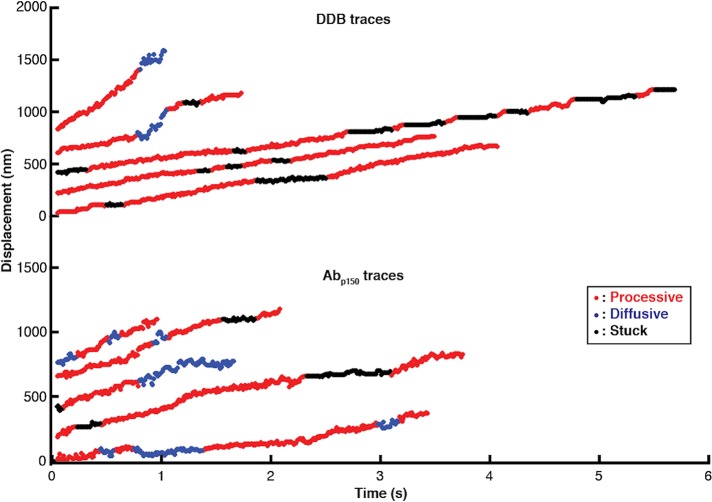
FIGURE 5:
High-resolution DDB tracking and motility state identification. Sample traces of control DDB (top) and DDB in the presence of Abp150 (bottom) taken at 100 frames/s by iSCAT microscopy and processed with the state switching algorithm. Processive segments are labeled in red, diffusive episodes in blue, and stuck durations in black.

