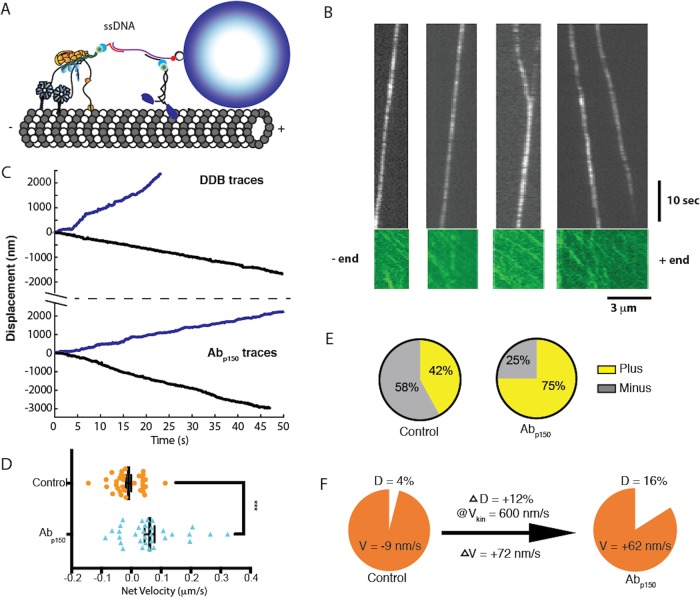
FIGURE 7:
p150 activates DDB in kinesin–DDB bidirectional transport. (A) Diagram of the reconstituted bidirectional transport system. Single kinesin-1 and DDB are connected through single-stranded DNA-functionalized GBP1 and GBP2 adapters to a double-stranded DNA scaffold, linked at its biotinylated 5′ end to a streptavidin-coated Qdot. (B) Kymographs Qdot-labeled DDB–kinesin-1 (top) in the 647 nm channel, and the excess kinesin-1 motors streaming to the plus end in the GFP channel (bottom), used to identify the polarity of the microtubule. See also Supplemental Video S2. (C) Sample traces of DDB–kinesin-1 for control (top) and the Abp150 group (bottom). (D) Velocities of the control group (orange; −9.1 ± 9.2 nm/s; mean ± SEM, n = 33) and the Abp150 group (blue: 62 ± 17 nm/s; mean ± SEM, n = 32) calculated from linear regression to entire traces. The two groups were significantly different by two-tailed t test, ***, p < 0.0005. (E) Percent of plus-end directed cargoes (yellow) and minus-end directed cargoes (gray) for the control kinesin–DDB group (left) and the Abp150 group (right). (F) Graphical explanation of velocity shift. Blocking p150 increased the fraction of time in the diffusive state by 12%. If it is assumed that the complexes move at the unloaded kinesin-1 velocity during this time, then the expected shift in mean velocity is 0.12 * 600 nm/s = 72 nm/s toward the plus end, in agreement with measurements.

