FIGURE 1:
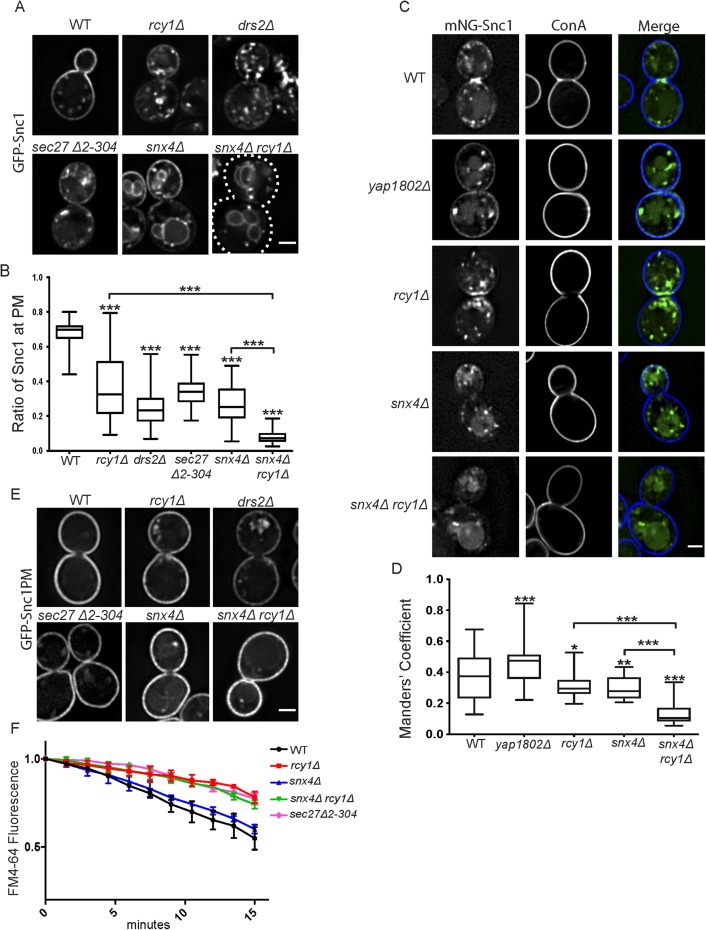
Roles of Rcy1 and Snx4 in Snc1 recycling. (A) WT and mutant cells expressing GFP-Snc1 were imaged at 1000×. Images shown are single planes chosen from a z-stack series. (B) Quantification of images captured in A (n = 50); images were analyzed by determining the ratio of GFP signal at the PM as a function of total fluorescent signal. (C) WT and mutant cells expressing a Cu-induced mNG-Snc1 construct at low levels were stained with fluorescently labeled ConA and imaged at 1000×. Images shown are single planes. (D) Channels were separated and thresholded, then correlation was measured by finding the MCC between the channels (n = 50) (E) Wild-type and mutant cells expressing an endocytosis deficient GFP-Snc1(PM) were imaged at 1000×. Images shown are single planes. (F) Measurement of FM4-64 postendocytic recycling in WT and mutant cells. Fluorescence intensity was normalized to the initial value for each strain. Data represent three independent experiments. Scale bars represent 2 µm.

