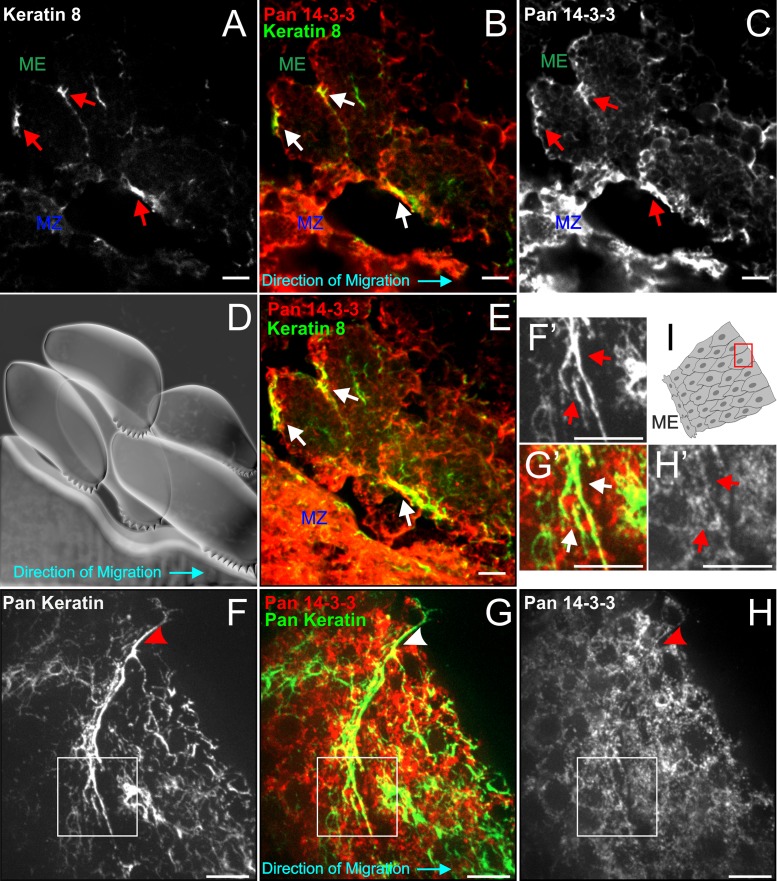
FIGURE 3:
Filaments recruited to cell–cell adhesions associate with 14-3-3. (A–C) Single plane confocal images showing a sagittal perspective of a cryosectioned gastrulating embryo labeled immunocytochemically for 14-3-3 proteins (red) and K8 (green). Areas where filamentous colocalization was detected in B are illustrated by arrows in all three panels. (D) Cartoon schematic depicting orientation of cells in A–C. The blue arrow indicates direction of tissue migration. (E) Maximum intensity projection of confocal z-stack of cells shown in A–D to show more comprehensive filament distribution. (F–H) Leading edge of a mesendoderm explant demonstrating association between 14-3-3 and keratins (pan-keratin antibody labeling) at a cell–cell interface (arrowheads). Closer inspection of the keratin morphology at this area (F’–H’) reveals filamentous 14-3-3 labeling. (I) Explant schematic depicting the cell pair (F–H) relative to the rest of the tissue. Images are z-stacks (maximum intensity projection). Scale bars are 10 μm.

