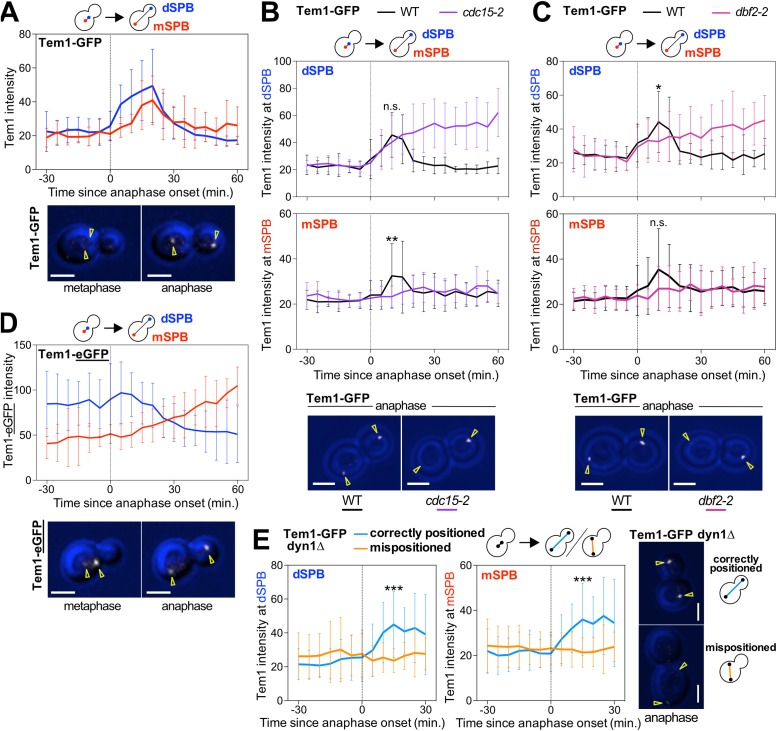
FIGURE 2:
Tem1 accumulates at the SPB that moves into the daughter cell during anaphase. (A–E) Quantification and representative images of Tem1 localization at the SPBs. Cells were imaged by time-lapse microscopy every 5 min for 3–6 h to determine the intensity (max(SPB)-mean(slide)) of Tem1 at either the mother cell-localized SPB (mSPB) or the daughter cell-localized SPB (dSPB). In metaphase, the SPB closer to the bud neck was designated as the dSPB. Curves show mean and SD for 20 cells per condition. Data were centered at the first frame of anaphase (spindle length >3 μm). Student’s t test was used to assess statistical significance at time points when association of Tem1 with SPBs was maximal in wild-type cells. Representative sample images of a cell in metaphase or anaphase with the indicated fluorescently tagged protein in white. Yellow arrowheads indicate location of the SPBs determined from Tub1 localization. Scale bars are 3 μm. (A, D) Cells containing mCherry-TUB1 and TEM1-GFP (A, Ay22556) or TEM1-yEGFP (D, Ay21613) were imaged at 25°C. Cells were chosen for analysis in which a SPB entering the bud coincided with anaphase onset. (B, C) Wild-type (Ay22556), cdc15-2 (Ay40721), or dbf2-2 (Ay40876) cells containing TEM1-GFP and mCherry-TUB1 were shifted from room-temperature to 32°C and imaged. Cells were chosen for analysis where a SPB entering the bud coincided with anaphase onset. (E) The dyn1Δ cells containing TEM1-GFP and mCherry-TUB1 (Ay22666) were imaged at 25°C. Cells where a SPB entering the bud coincided with anaphase onset (correctly positioned) were compared with cells where a SPB did not enter the bud until at least 30 min after the onset of anaphase (mispositioned).

