FIGURE 3:
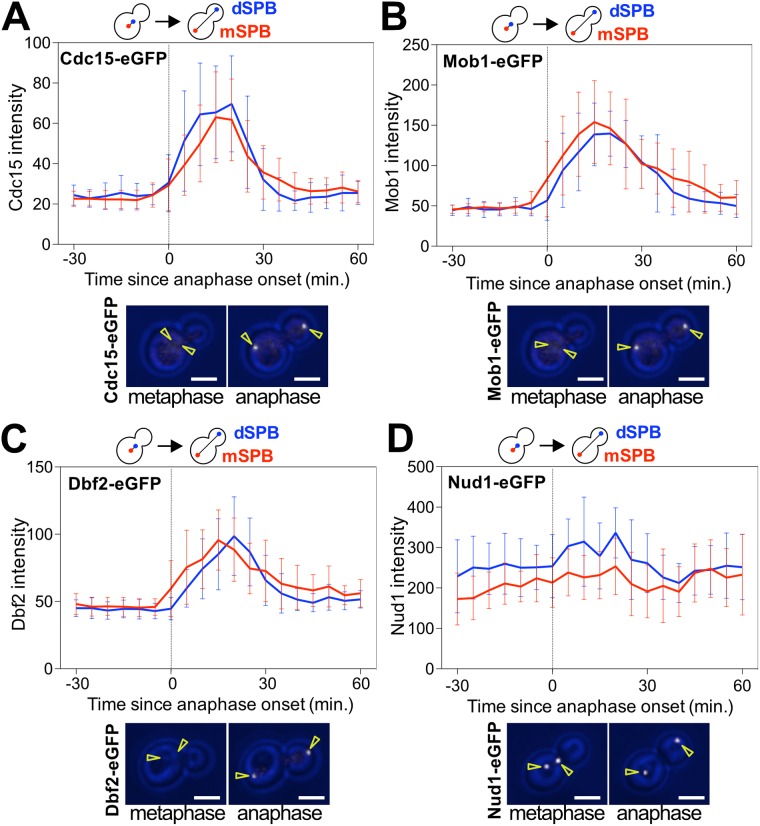
The MEN kinases accumulate at both SPBs at the onset of anaphase. (A–D) Localization of MEN proteins at SPBs in an unperturbed cell cycle. Cells were imaged every 5 min for 3–6 h to determine the intensity (max(SPB)-mean(slide)) of the indicated fluorescently tagged proteins at either the mSPB or the dSPB. Curves show mean and SD for 20 cells per condition. Data were centered at the first frame of anaphase (spindle length > 3 μm). Representative sample images with the indicated fluorescently tagged protein in white. Yellow arrowheads indicate location of the SPBs determined from Tub1 or Spc42 localization. Scale bars are 3 μm. Cells were imaged at 25°C. Cells were chosen for analysis where a SPB entering the bud coincided with anaphase onset. (A) CDC15-eGFP, mCherry-TUB1 (Ay26481). (B) MOB1-eGFP, SPC42-mCherry, CDC14-tdTomato (Ay39323). (C) DBF2-eGFP, SPC42-mCherry, CDC14-tdTomato (Ay39273). (D) NUD1-yEGFP, SPC42-mCherry (Ay40869).

