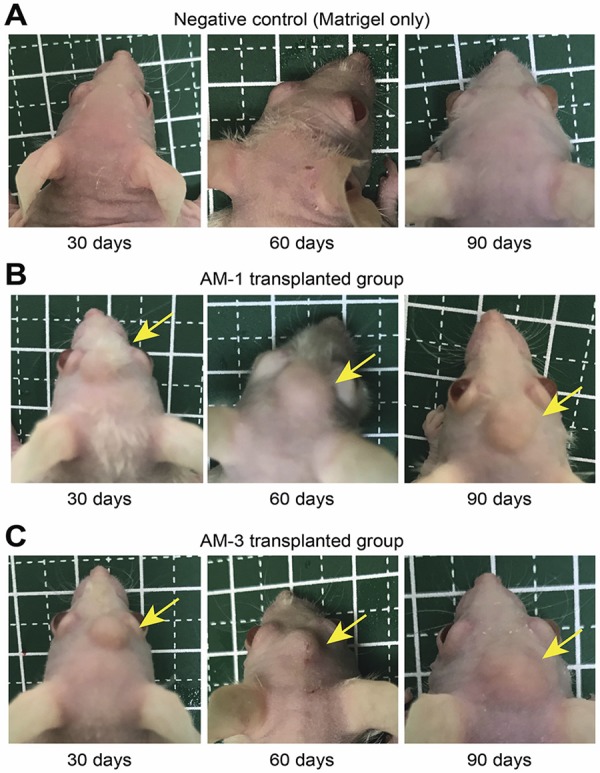
Figure 1. Images of the heads of mice at each time point: 30, 60, and 90 days. (A) Negative control group: transplanted with Matrigel without cells. (B) AM-1 group: transplanted with AM-1 cells with Matrigel. (C) AM-3 group: transplanted with AM-3 cells with Matrigel. Yellow arrows indicate the tumor mass.

