. 2020 Apr 1;9:e54532. doi: 10.7554/eLife.54532

Figure 2. The GT-A common core and its elements.

(A) Plot showing the schematics of the GT-A common core with 231 aligned positions. Conserved secondary structures (red α-helices, blue β-sheets, green loops) and hypervariable regions (HVs)(orange) are shown. Conservation score for each aligned position is plotted in the line graph above the schematics. Evolutionarily constrained regions in the core: the hydrophobic positions (yellow) and the active site residues (DxD: Cyan, xED: Magenta, G-loop: green, C-His: olive) are highlighted above the positions. (B) The conserved secondary structures and the location of HVs are shown in the N-terminal GT2 domain of the multidomain chondroitin polymerase structure fromE. coli(PDB: 2z87) that is used as a prototype as it displays closest similarity to the common core consensus. (C) Active site residues of the prototypic GT-A structure. Metal ion and donor substrate are shown as a brown sphere and sticks, respectively. (D) Architecture of the hydrophobic core (Yellow: core conserved in all Rossmann fold containing enzymes, Red: core elements present only in the GT-A fold). Residues are labeled based on their aligned positions. Numbers within parentheses indicate their position in the prototypic (PDB: 2z87) structure.

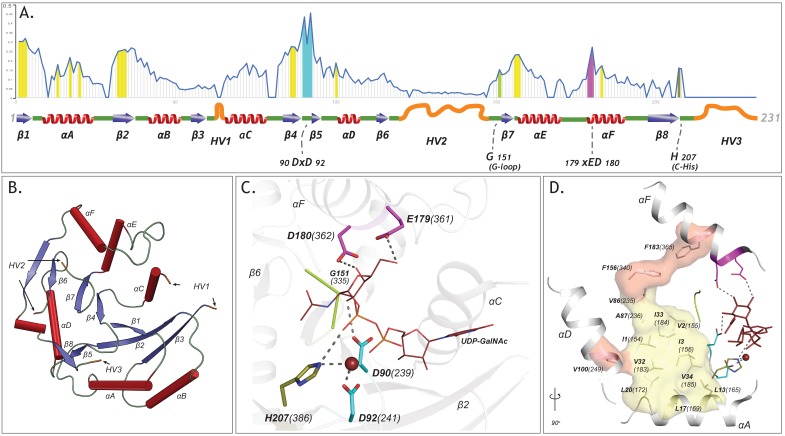
Figure 2.

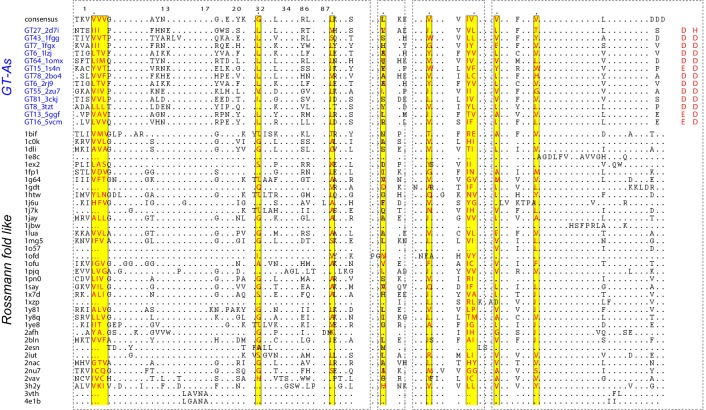
Figure 2—figure supplement 1. Structure based sequence alignment showing the hydrophobic residue positions present across a collection of Rossmann fold like enzymes.

Figure 2—figure supplement 1.

The conserved hydrophobic positions are highlighted in yellow blocks. Aligned positions are indicated at the top that correspond to aligned positions in Figure 2D. The alignment extends until the DxD motif. Other regions were unaligned due to very low homology.
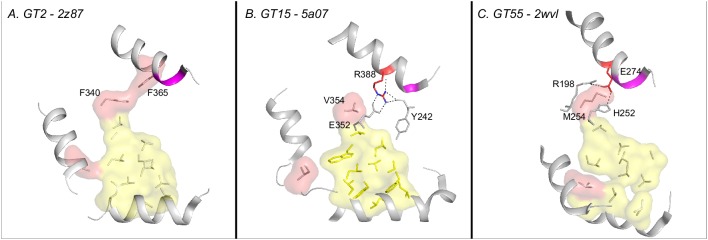
Figure 2—figure supplement 2. Changes in the extended hydrophobic core residues in selected retaining families.

Figure 2—figure supplement 2.

(A) The conserved hydrophobic core in the prototypic GT (2z87). (B and C) Hydrophobic residue in the core is substituted by an Arginine and a Glutamate in GT15 and GT55 respectively. The charged residue replacing the hydrophobic residue of the core is highlighted in red sticks. The xED motif is shown in magenta.
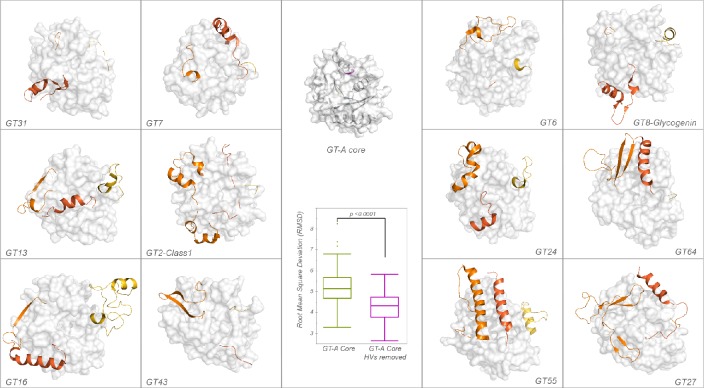
Figure 2—figure supplement 3. Comparison of structures for HV regions across GT-A families.

Figure 2—figure supplement 3.

The GT-A common core is shown in surface in the middle. HVs are shown in shades of orange (HV1: light orange, HV2: dark orange, HV3: orange red). Root Mean Square Deviation (RMSD) was calculated by aligning the core GT-A domains of representative structures with and without the HVs. A significant reduction in the RMSD values was observed after removing HVs that is shown in the box plot in the center. *p-value<0.0001, t-test.