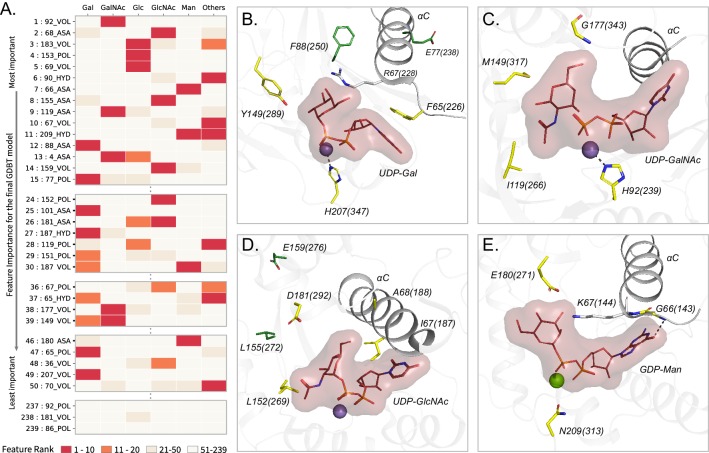
Figure 7. Top Contributing features from the GDBT model associated with sugar donor specificity.
(A) Heatmap showing the contributions of representative features. Features are ordered based on their importance for the final GDBT model along the vertical axis. The heatmap colors indicate how important each feature is for a given sugar donor type with red indicating ranks 1–10 (highly important) (M). (B–E) Contributing features important for individual donor types are mapped onto representative structures. The amino acids at the feature positions are shown in yellow sticks and labelled. Feature positions distal from the donor binding site are shown in green sticks. Labels include the amino acid code, aligned residue position and the amino acid position in the crystal structure within parentheses. Donor substrate with the sugar is shown in lines with surface bounds. Divalent metal ions are shown as spheres. The αC helix is shown. (B) Gal features mapped to a bovine β−1,4 Gal transferase (PDB ID: 1o0r). (C) GalNAc features mapped to a human UDP-GalNAc: polypeptide alpha-N-acetylgalactosaminyltransferase (PDB ID: 2d7i). (D) GlcNAc features mapped to a rabbit N-acetylglucosaminyltransferase I (PDB ID: 1foa). (E) Man features mapped to a bacterial Mannosyl-3-Phosphoglycerate Synthase (PDB ID: 2wvl).

