. 2020 Mar 23;9:e52676. doi: 10.7554/eLife.52676

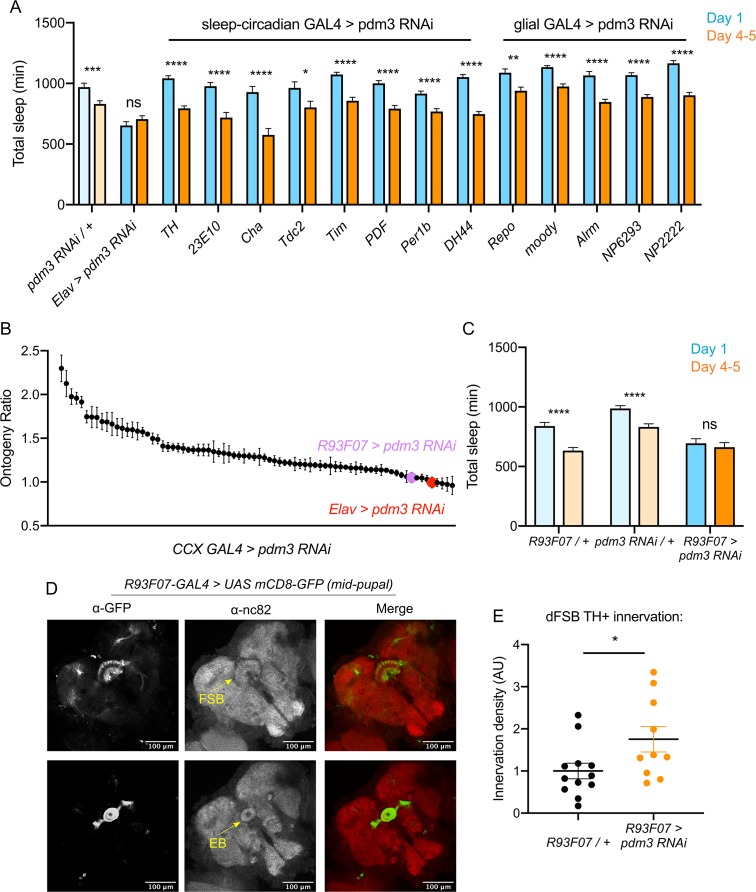
Figure 6. Pdm3 acts in R93F07+ CCX target cells to control sleep ontogeny.

(A) Total sleep time: pdm3 knockdown with spatially restricted GAL4 drivers with expression in sleep/circadian circuitry or glial expression (n ≥ 8 per genotype/age). (B) Spatial mapping screen of FlyLight GAL4 lines with adult CCX expression patterns (n ≥ 8 per genotype/age). (C) Total sleep time in R93F07-GAL4 > UAS pdm3 RNAi versus controls (n = 41, 32, 40, 40, 40, 40 left to right). (D) At the mid-pupal stage, R93F07-GAL4 is expressed in the FSB (top) as well as the ellipsoid body (EB, bottom). (E) Innervation density of TH+ neurites in the adult dFSB (labeled by TH-LexA >LexAOp GFP) with R93F07-GAL4 driving pdm3 RNAi (n = 12 controls, 10 pdm3 RNAi). ****p<0.0001, ***p<0.001, **p<0.01, *p<0.05; multiple Student’s t tests with Holm-Sidak correction, alpha = 0.05 (A, C), unpaired two-tailed Student’s t test plus Welch’s correction (E).

Figure 6.

Figure 6—figure supplement 1. Expression pattern of 23E10-GAL4 in the mid-pupal brain.

Figure 6—figure supplement 1.

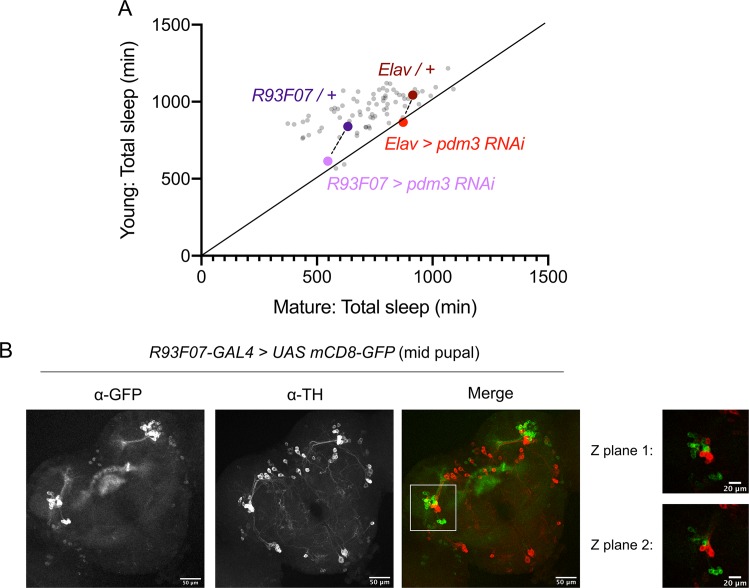
Figure 6—figure supplement 2. Sleep amounts from spatial mapping screen identifying R93F07+ cells.

Figure 6—figure supplement 2.

(A) Spatial mapping screen of FlyLight CCX-expressing GAL74 lines, plotted as total sleep time in young versus mature flies of each genotype (n ≥ 8 per genotype/age). Compared to genetic controls (darker dots), Elav or R93F07 GAL4 >pdm3 RNAi (lighter dots) results in young and mature flies having the same amount of sleep. Relationship between genetic controls and pdm3 RNAi is shown by the dotted lines. Co-labeling of TH+ neurons (labeled by anti-TH) and R93F07+ neurons (labeled by anti-GFP). (B) R93F07+ cells are not dopaminergic. While the merged Z-stack shows some apparent overlap in TH+ and R93F07-GFP signal, this stems from overlap of Z planes rather than true co-labeling.