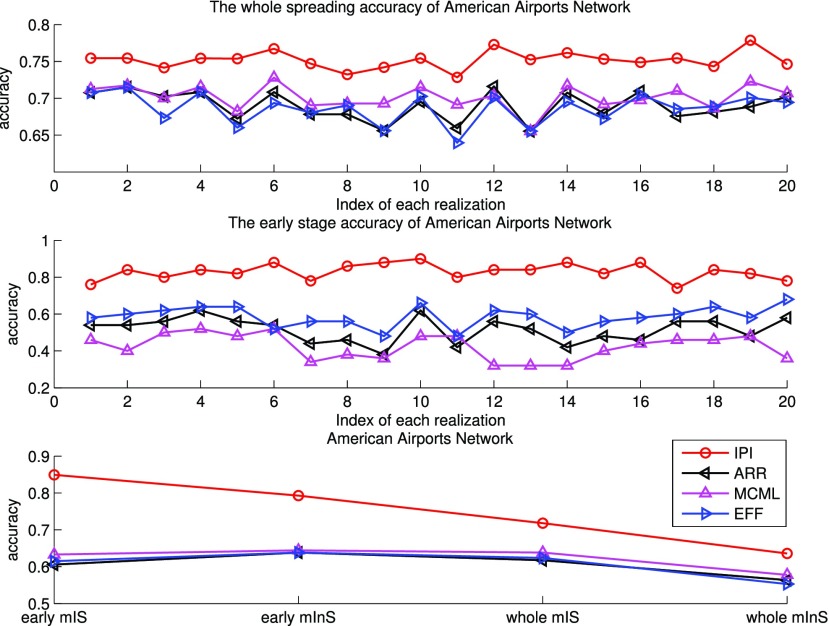
Fig. 5.

Top and middle: identified accuracy for the whole and early stage (before appearance of the first 50 infected subpopulations) invasion pathways for 20 independent spreading realizations on the AAN. Bottom: accumulative identified accuracy of INCs ( and
and  ) for the early stage and the whole invasion pathways on the AAN.

