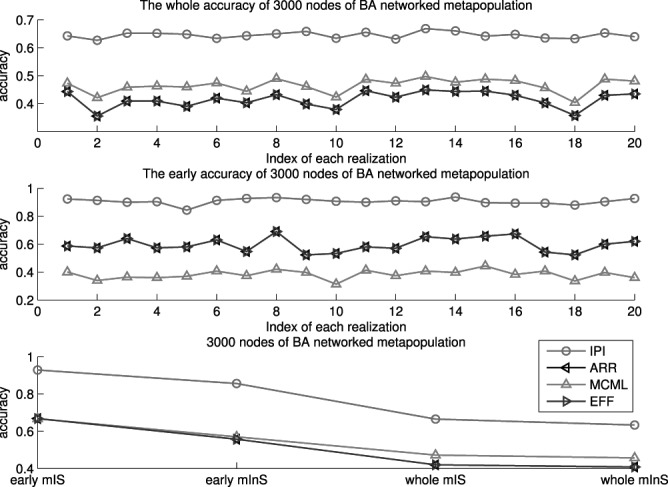
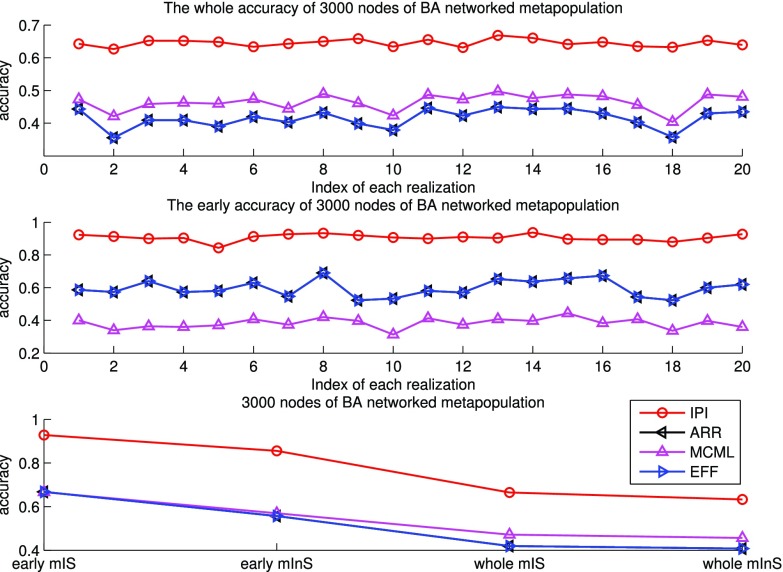
Fig. 6.

Top and middle: identified accuracy for the whole and early stage invasion pathways for 20 independent spreading realizations on 3000 subpopulations of the BA networked metapopulation. Bottom: accumulative identified accuracy of  and
and  for the early stage (the first 300 infected subpopulations) and the whole invasion pathways on 3000 subpopulations of the BA networked metapopulation.

