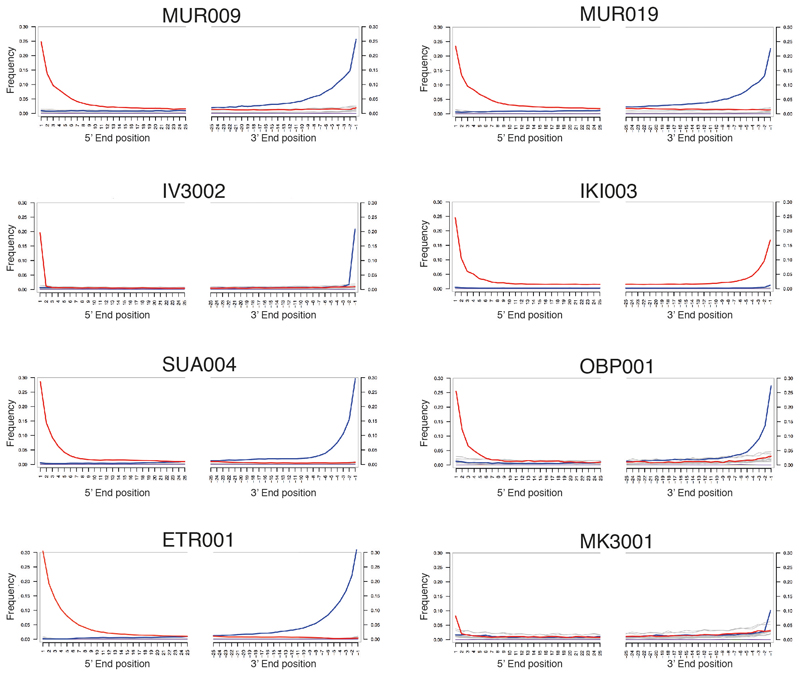
Extended Data Fig. 9. Mismatch distribution along positions at the 5’- and 3’- end of mapped sequencing reads.
C to T changes indicated in red and G to A changes in blue, all other substitutions in grey. IV3002 and MK3001 are UDG-half treated, which leads to observable damage only in the terminal positions. Plots generated with mapDamage2 (Jónsson H. et al, Bioinformatics 2013).

