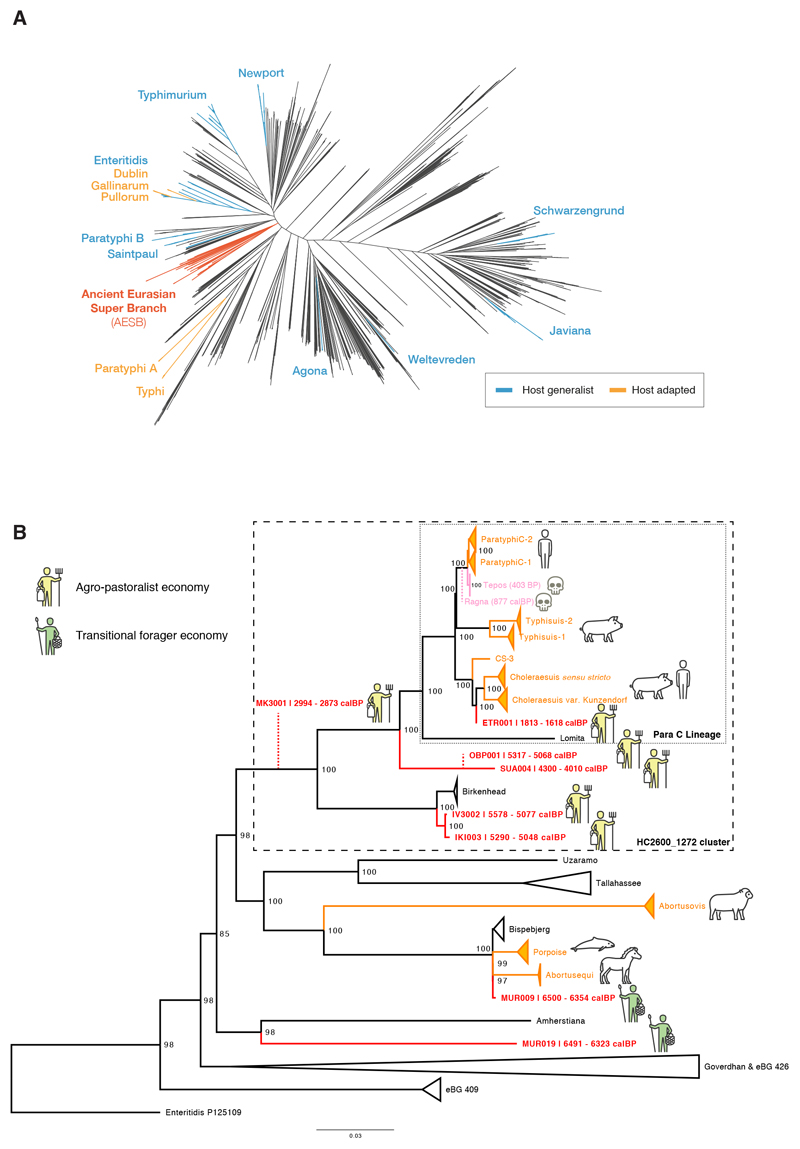
Figure 2. Phylogenetic relationships of reconstructed ancient and modern S. enterica core genomes.
(a) Maximum likelihood tree of the ancient genomes (>5X coverage) and 2,961 modern S. enterica genomes, including 182,645 SNP positions in the core genome. Selected branches are identified based on predicted serotype provided by EnteroBase and coloured according to host specificity (blue/orange), if they include ancient genomes (red), or not specified (black). (b) Maximum likelihood tree of the AESB including the ancient genomes (>5X coverage) and 463 S. enterica genomes, considering 37,040 SNP positions in the core genome. New ancient genomes are shown in red, and previously reported ancient genomes (Ragna, Tepos) in pink. Ancient human economy is indicated for all newly presented genomes based on archaeological and ancient human genetic information. Low coverage ancient genomes (coverage <5X) are phylogenetically placed (red dashed line) based on all SNP positions covered once: MK3001: 17,324; OBP001: 26,657; and Ragna: 35,465. Modern genomes are collapsed based on their predicted serovar, eBurst group (closely related sequence types), or available metadata in EnteroBase. Host adapted serovars are coloured orange (incl. a pictogram of the host species). Bootstrap values are shown in black at each node (1,000 bootstraps). Black dashed rectangles show extends of Para C Lineage and hierarchical cluster HC2600_1272. Enteritidis P125109 is used as the outgroup.

