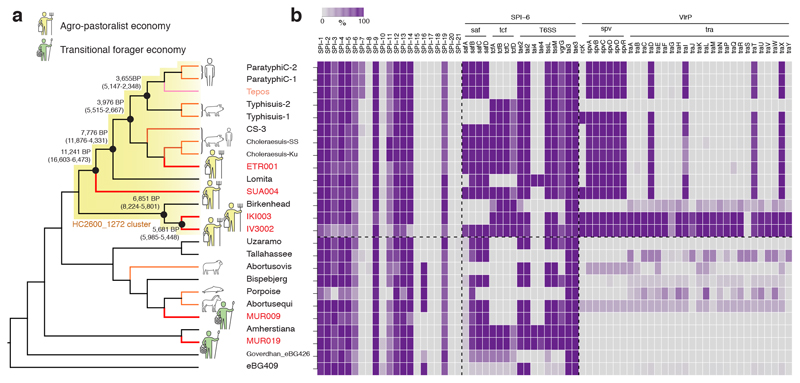
Figure 3. AESB topology, divergence times and gain-loss events.
(a) Topology of the AESB highlighting the hierarchical cluster HC2600_1272 (yellow), with symbols indicating ancient human economy of S. enterica positive samples. Selected divergence time estimates for the HC2600_1272 cluster are shown in years BP (95% highest posterior density intervals, see also Supplementary Table 2). (b) Gain-loss results for all SPI’s and selected genes. For SPI’s, colour gradient relates to the average of %-genes covered over 95% across all strains per branch. For genes, colour gradient according to mean percentage covered across all strains per branch. Tepos: 16th century Mexican.

