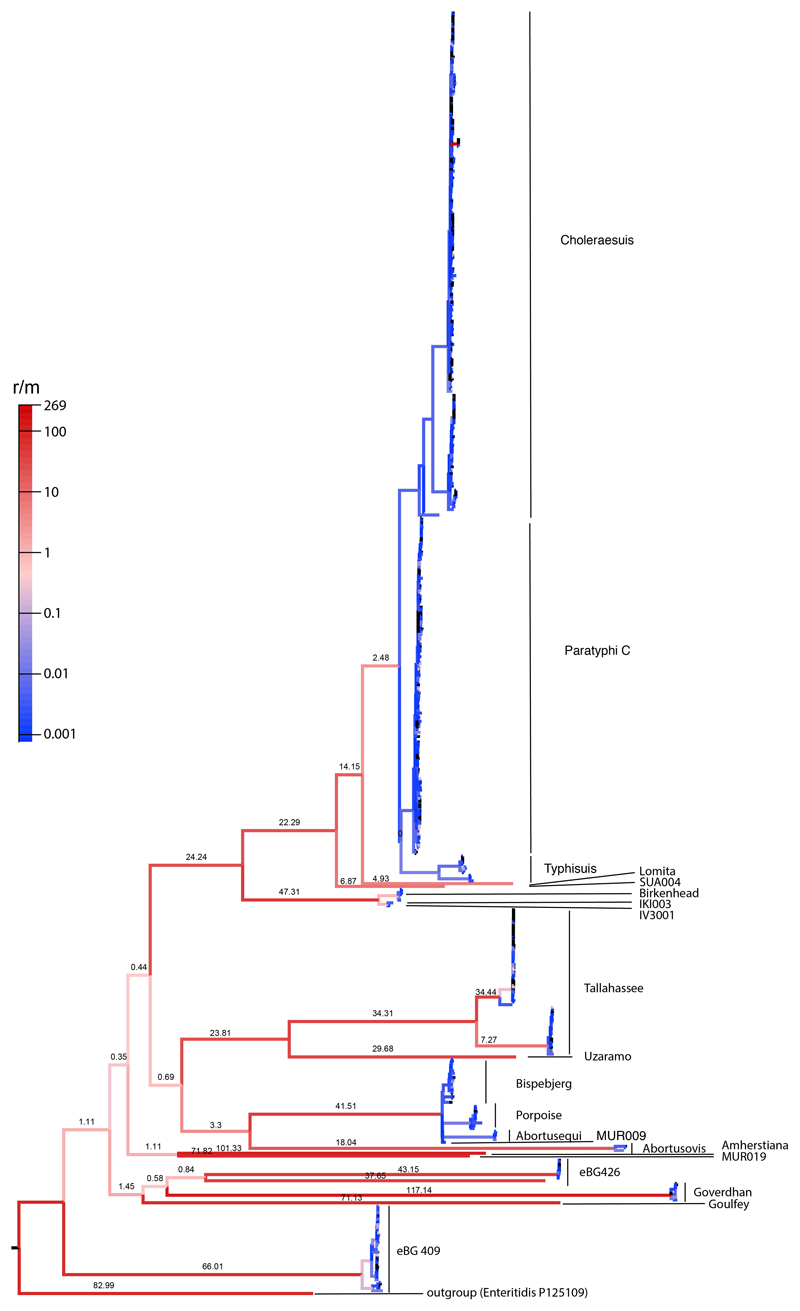
Extended Data Fig. 4. Recombination rate estimates for the AESB.
Estimated recombination rate is shown as recombination event per mutation event (r/m) and indicated on top of branch and by branch color. Recombination events have been inferred using all positions shared by 95% of strains from the AESB and are here reported for the SNPs shared by all strains on the AESB (correspond to maximum likelihood phylogeny shown in Figure 2B). Maximum likelihood tree including all SNPs shared by at least 95% of strains from the AESB is shown in Extended Data Fig. 3.

