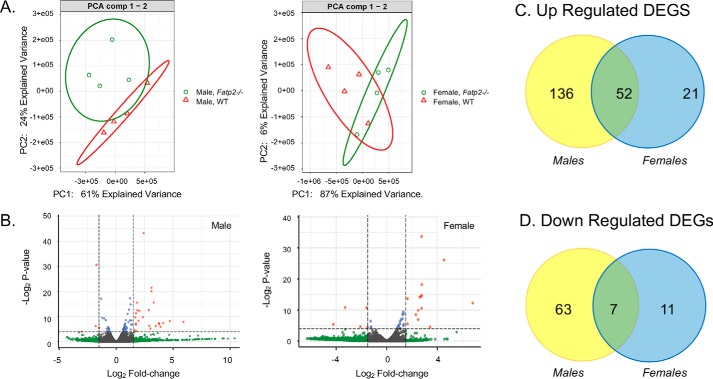
Figure 3.
WT and Fatp2−/− liver transcriptomes are distinguishable. A, PCA plots of gene counts from the liver transcriptomes from control (red) and Fatp2−/− (green) male (left) and female (right) mice using unsupervised clustering (n = 4). B, volcano plots of genes from Fatp2−/− male (left) and female (right) liver tissue generated using a log2 -fold change and corrected p values of the genes in the male and female RNA-Seq data. The genes in red meet both the p value cut-off (p ≤ 0.05) and log2 -fold change cut-off (≥1.5); genes in blue meet the p value cut-off but not log2 -fold change; and those in gray do not meet either the p value or the log2 -fold change threshold. (n = 4). C, up-regulated DEGs in the liver from male (yellow) and female (blue) Fatp2−/− mice with 52 in common. D, down-regulated DEGs in the liver from male (yellow) and female (blue) Fatp2−/− mice with seven in common.

