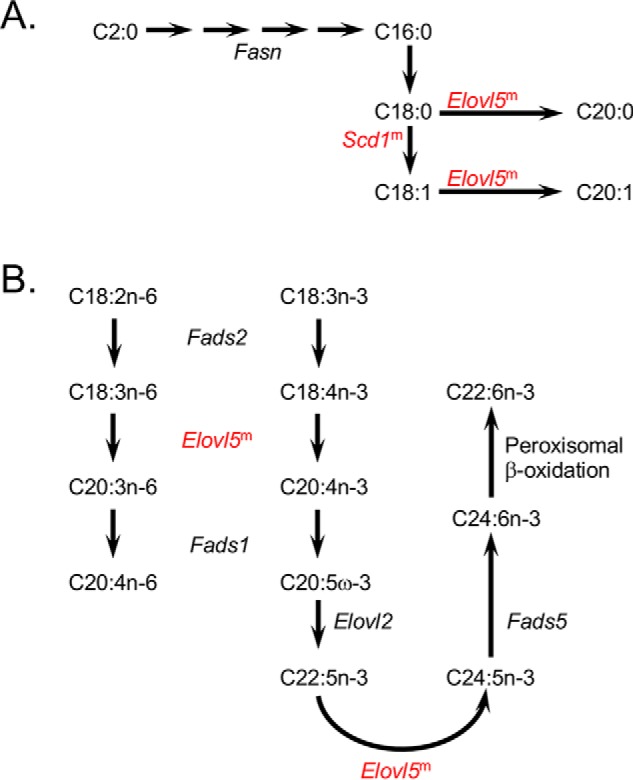
Figure 5.

Fatty acid synthesis pathways enriched in DEGs of the Fatp2−/− liver. A, DEGs in de novo fatty acid biosynthesis and fatty acid elongation. B, DEGs in essential fatty acid (C18:2 and C18:3) metabolism. For A and B, DEGs increased in expression are colored in red; for genes noted with superscript m, expression changed only in male mice; the genes noted in black were detected but were unchanged between the control and Fatp2−/− mice.
