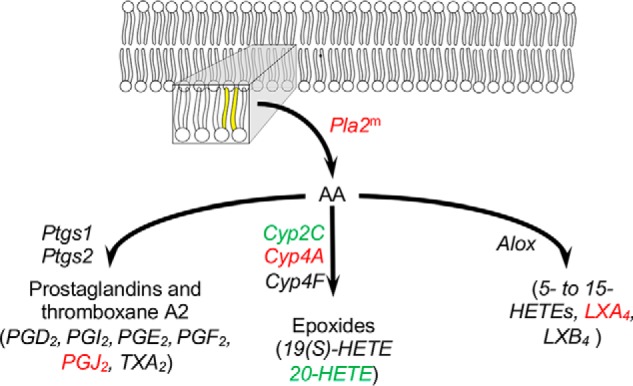
Figure 7.

Arachidonic acid metabolic pathway is enriched in DEGs of the Fatp2−/− liver. DEGs increased or decreased in expression are colored in red and green, respectively; for genes noted with superscript m, expression changed only in male mice; the genes noted in black were detected but were unchanged between the control and Fatp2−/− mice. The acyl chains colored in yellow indicate arachidonic acid (AA) in the membrane that is released by Pla2. Metabolites measured are italicized, showing those with increased (red), decreased (green), or unchanged (black) levels.
