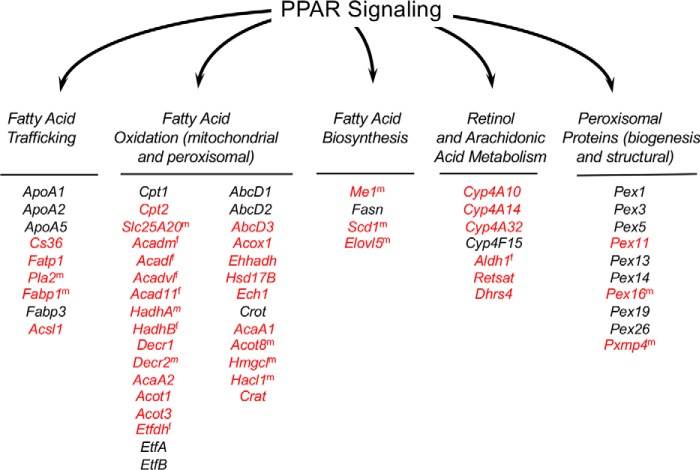
Figure 8.
Genes regulated through PPARα are increased in Fatp2−/− mice. All PPARα-regulated genes detected in the transcriptomic data set are noted and clustered into pathways related to fatty acid trafficking, fatty acid oxidation, fatty acid biosynthesis, retinol and arachidonic acid metabolism, and peroxisome proteins. Genes noted in red have increased expression in the Fatp2−/− mice; those in black were detected but were unchanged when compared with the isogenic controls. Superscript m or f indicates that the expression of the noted gene was increased only in male or female liver, respectively.

