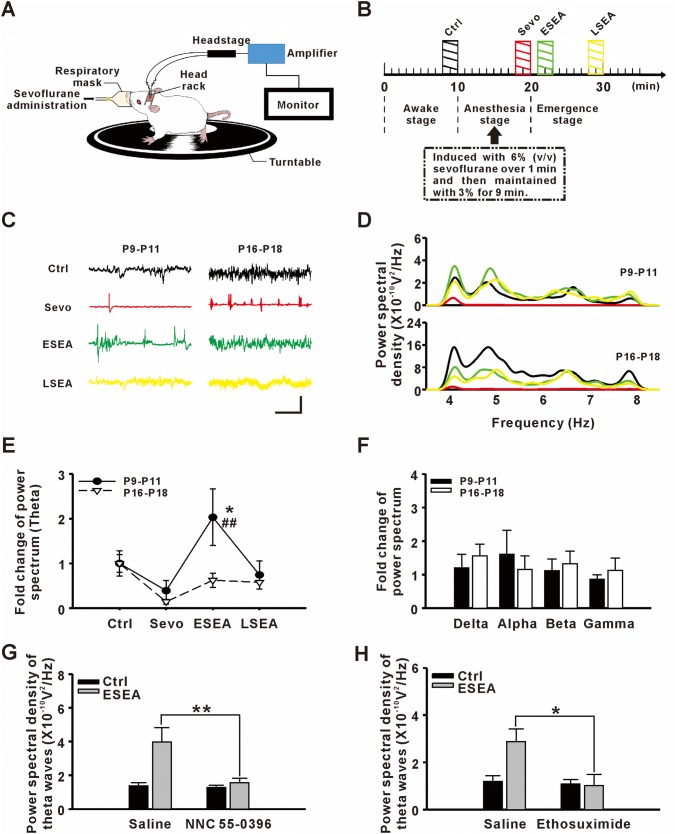
Fig. 3.
Potentiated theta oscillations in the frontal lobe when generating post-anesthetic hyperexcitatory behaviors (PAHBs). A Sketch of EEG recording during the peri-anesthesia period. B Schematic of the EEG recording process. Shaded bars indicate periods of EEG analysis: Ctrl (black, baseline recording), Sevo (red, recording under sevoflurane anesthesia), ESEA (green, recording at the early stage of emergence from anesthesia), and LSEA (yellow, recording at a later stage of emergence from anesthesia). C Samples of EEGs from different groups and stages (scale bars; 0.2 mV and 5 s; color coding as in B). D Power spectra of theta oscillations in different groups and stages. E Fold-changes of power spectra of theta oscillations (n = 8–10; *P ≤ 0.05 vs Ctrl; ##P ≤ 0.01 vs P16-P18, two-way ANOVA followed by Bonferroni’s t-test). F Fold changes of power spectra of delta, alpha, beta, and gamma oscillations. G Effect of NNC 55-0396 on the power spectrum of theta oscillations at ESEA (n = 7–8; **P ≤ 0.01 vs saline, Student’s t-test). H Effect of ethosuximide on the power spectrum of theta oscillations at ESEA (n = 6 per group; *P ≤ 0.05 vs saline, Student’s t-test).

