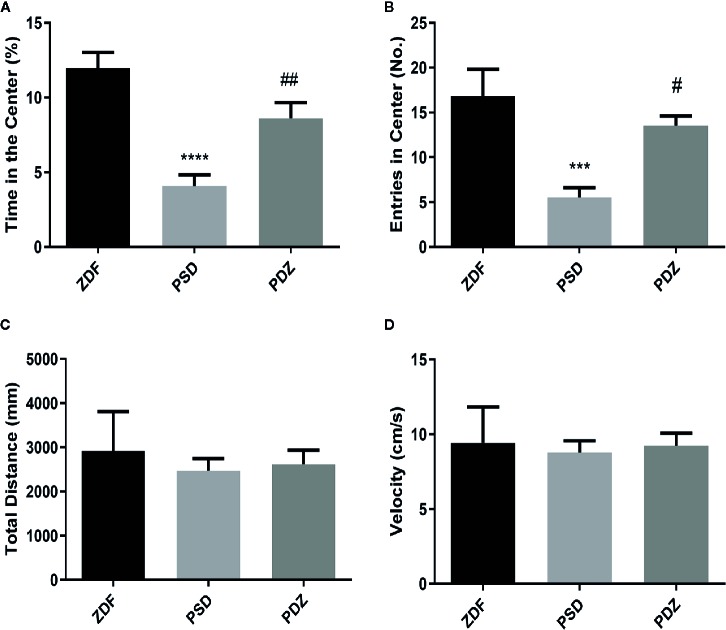
Figure 2.
Effect ZBPYR on activities in the open-field test. Performance of ZDF rats in each group was measured, including time in the center (%) (A), entries in the center (B), total distance (C) and velocity (D). Bars represent the mean ± SEM of 6 rats per group. *** P < 0.001, **** P < 0.0001, PSD group vs. ZDF group; # P < 0.05, ## P < 0.01, PDZ group vs. PSD group.

