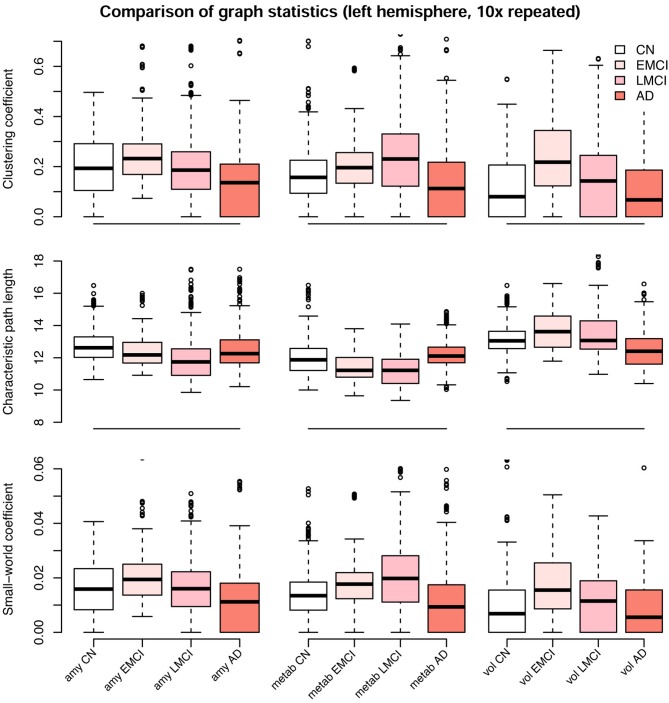
Figure 9.
Comparison of graph statistics for the partial correlation matrices of the left hemisphere stratified by diagnostic group and image modality. Estimates based on Gaussian graphical models using multimodal neuroimaging data. The distribution of the weighted clustering coefficient, characteristic weighted path length, and small-world coefficient for individual brain regions is shown. Boxes display median, first and third quartile of the distributions, and whiskers indicate ±1.5 × interquartile range. All blocks showed significant differences in mean between groups, one-way analysis of variance (ANOVA), df = 215, F > 4, p < 0.01. P-values for Tukey's honest significant difference tests are given in Table 2. CN, cognitively healthy elderly controls; EMCI/LMCI, early and late amnestic mild cognitive impairment; AD, Alzheimer's dementia; amy, amyloid-β; metab, glucose metabolism; vol, gray matter volume.

