
Figure 1.
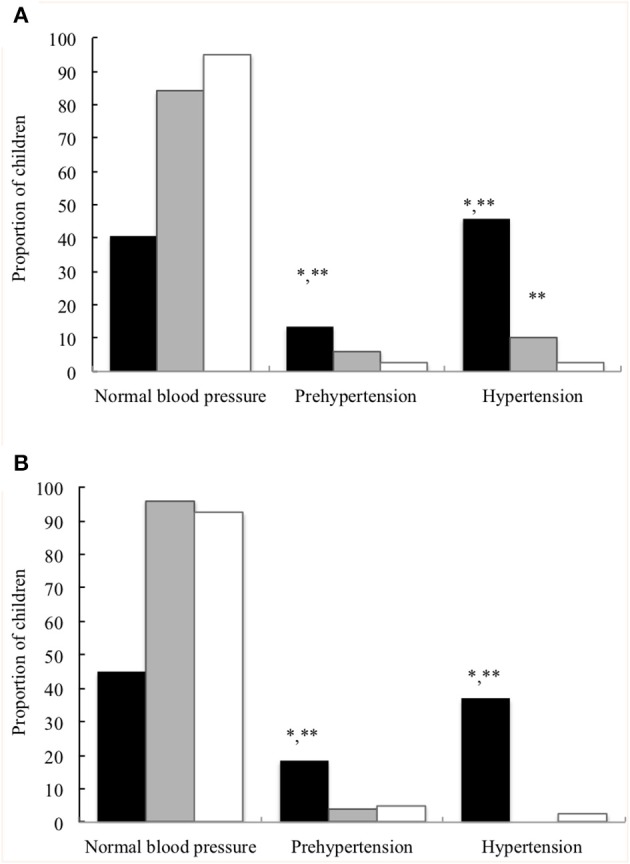
Proportion of children with normal blood pressure percentile, prehypertension, and hypertension at the prepubertal age. (A) Systolic blood pressure. (B) Diastolic blood pressure. Children with a history of prematurity and extrauterine growth restriction (EUGR group, N = 38; ■), children with a history of prematurity without EUGR (PREM group, N = 50; ) and control children (Control group, N = 123; □). *Value was significantly different from that of the PREM group with p-value < 0.001; **Value was significantly different from that of the control group with p-value < 0.001 (Chi-square test).