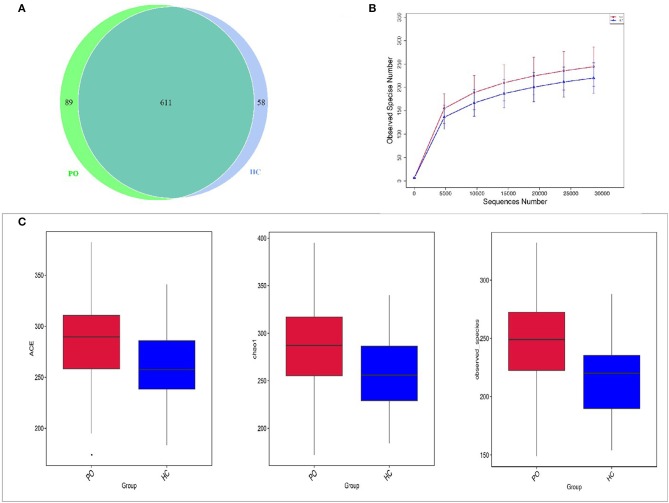
Figure 1.
Comparison of gut microbiome structure between PO and HC group. (A) Venn diagram: each circle in the figure represents a group, the number of overlapping parts represents the number of OTUs shared between the groups, and the number without overlapping parts represents the number of OTUs unique to the group. (B) Rarefaction Curve, Abscissa is the number of sequencing strips randomly selected from a sample, and ordinate is the number of OTU that can be constructed based on the number of sequencing strips, which is used to reflect the sequencing depth (Blue, HC; Red, PO). (C) The alpha diversity of the two groups of gut microbial communities was described according to the ACE, Chao1 and observed_species indices. Box plot reflects median, degree of dispersion, maximum, minimum, and outliers. P-values were determined using T-test and wilcox Rank Sum Test. HC, healthy control; PO, primary osteoporosis; OTU, operational taxonomic unit.

